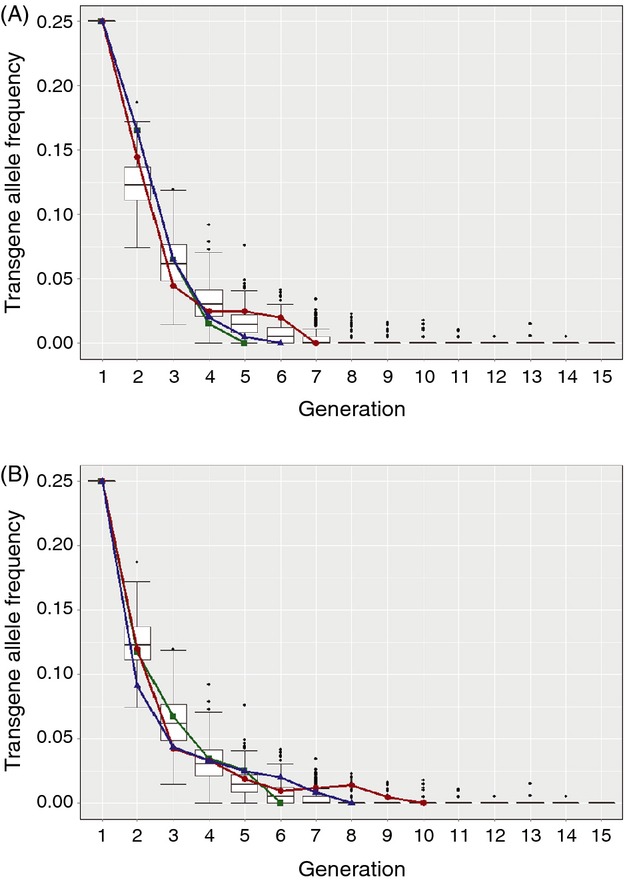
Figure 3.

Boxplots showing results from 250 iterations of a stochastic model simulating engineered female-specific selection on a fsRIDL allele in a panmictic, closed population of constant size over 15 discrete generations. We consider fsRIDL allele frequency with a starting population of 200 individuals and an initial fsRIDL allele frequency of 0.25 (f = 0.25) propagating in the absence of the transgene repressor (under restrictive conditions). Horizontal bold lines represent generational medians; upper and lower box lines represent first and third quartiles, respectively; outer horizontal lines represent 1.5× the interquartile range; and dots represent data points over 1.5× above or below the first and third quartiles, respectively. Overlaid onto the boxplots are lines (red, blue and green) showing allele frequency changes from three replicates of caged experiments tracking fsRIDL allele frequencies in mixed populations of (A) diamondback moth and (B) olive fly reared under analogous conditions to those used in the model (initial fsRIDL allele frequency of 0.25, restrictive conditions).
