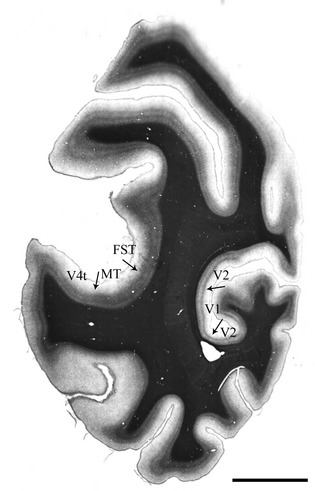
Figure 1.

Myelin stained tissue showing areas middle temporal (MT) and V1 in the same tissue section from animal A4. Arrows show the approximate location of the architectonic boundaries between visual areas, as determined from the pattern of myelin staining (Gallyas, see Methods). MT, V1 and the immediately adjacent areas (V4t, FST, and V2) are shown. Scale bar = 5 mm.
