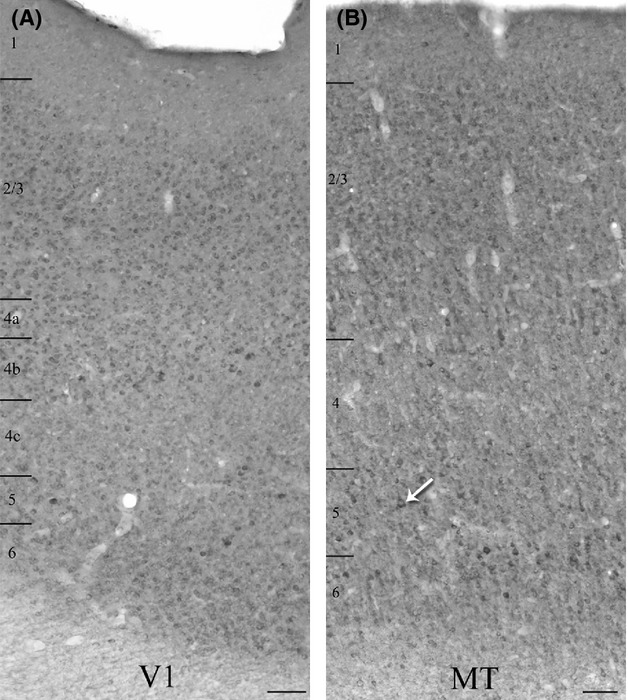
Figure 2.

Qualitative comparison of single-label immunoperoxidase reactivity for m1 ACh receptors in V1 (A), and the middle temporal visual area (MT) (B). Immunopositive somata are present in all cortical layers of both areas. Higher levels of neuropil immunoreactivity in area MT (B) make the immunopositive somata more difficult to identify at this magnification (10×) although some strongly labeled cell bodies are evident in layer 5 (see arrow, e.g.). The micrographs present images of the two areas from the same tissue section. Layer boundaries are indicated on the left of each panel. Imaged with a 10× objective. Scale bars = 100 μm.
