
Figure 7.
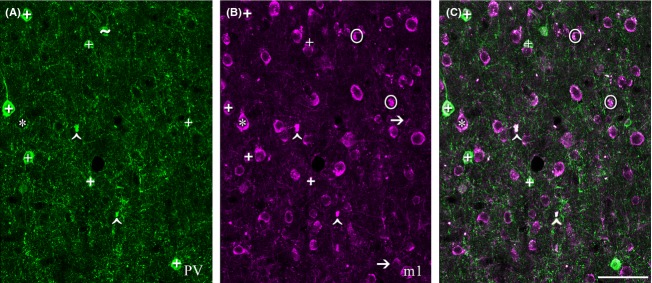
Most m1 AChR-immunoreactive neurons (panel B, magenta) in the middle temporal visual area (MT) are not immunoreactive for parvalbumin (PV; panel A, green). This image was captured in layer 5 of area MT using a 40× objective. There are seven PV neurons in the imaged field (+, A). Note that the cell body marked with a ∼ in panel A would not have been counted in this study as it does not have a clearly defined boundary within the imaging plane, although it is a PV neuron. Five of these seven PV neurons are also immunoreactive for the m1 AChR (+ in B and C). Two are m1-immunonegative (arrows in B). A striking feature of this image is the number of neurons that are immunoreactive for m1 AChRs (B, C), but not PV (A). Although these singly labeled m1-ir neurons occasionally appear pyramidal (*), it is generally not possible to determine cell morphology (or, therefore, cell class) from the immunoreactivity for m1 AChRs. The strongly fluorescent regions circled in B and C would not have been counted as they do not appear somatic in shape. These regions appear in only one channel and can thus be distinguished from the lipofuscin autofluorescence (∧ in A, B, and C) which is equally strong but appears in all channels. Scale bar = 100 μm.