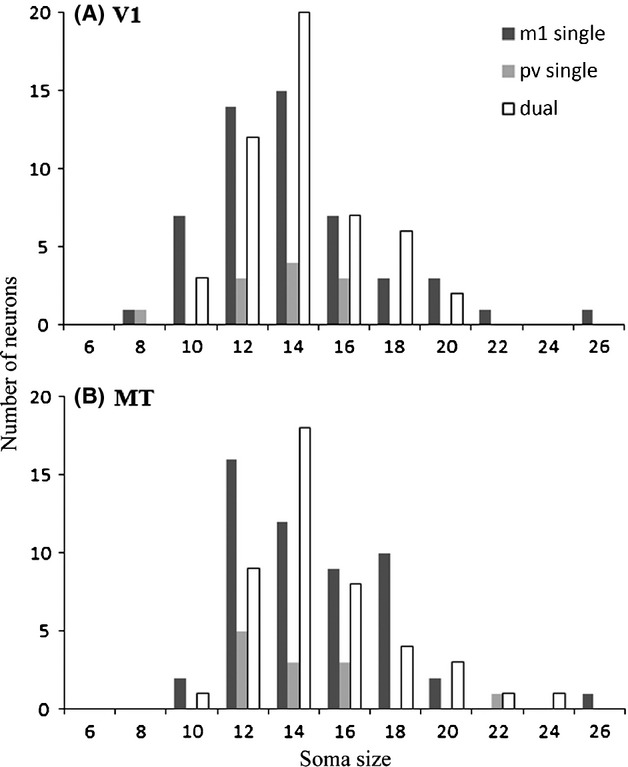
Figure 9.

The distributions of soma sizes are similar between the populations of singly and dually labeled neurons in V1 (A) or the middle temporal visual area (MT) (B). In these histograms of soma sizes, measured along the long axis, it can be seen that in V1 (A) the distributions for singly-labeled parvalbumin (PV)- and m1 AChR-ir neurons, and for dually immunoreactive neurons are unimodal and centered around 12–14 microns. In MT these distributions are shifted to the right and somewhat skewed, with a long tail at the end representing soma sizes greater than 20 μm. This tail of the distribution has a very small N, but all three groups (single PV-ir, single m1AChR-ir and dual PV/m1-ir) are represented in the population of neurons with large somata, offering no evidence for a bi-modal distribution of soma size in either cortical area. N for V1: m1 single = 52, PV single = 11, dual = 50 neurons. N for MT: m1 single = 52, PV single = 12, dual = 45 neurons.
