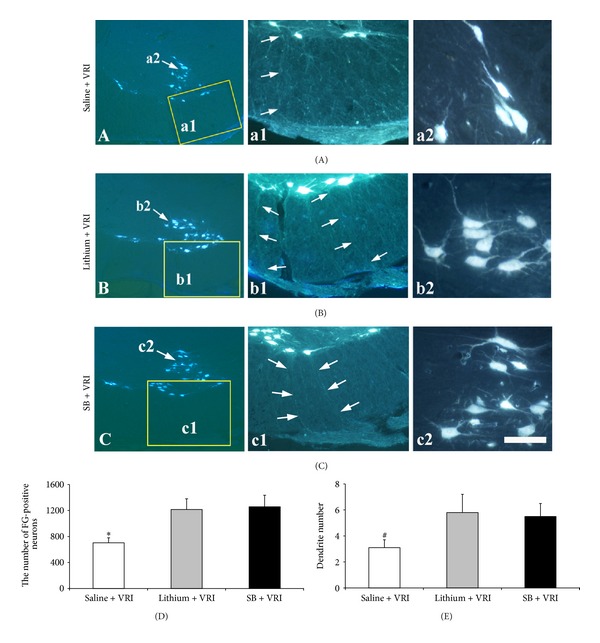
Figure 2.

Lithium treatment increased axonal regeneration and dendritic emanation of motoneurons after replantation of avulsed ventral roots. (A) A representative micrograph of spinal cross-sections showing FG-positive neurons (arrows) present in the ventral horn of the animals with ventral root reimplantation (VRI) plus saline treatment as controls. (a1) Micrographs made under higher magnification of the rectangular area in A showing that FG-labeled neurons extended their axons into the replanted ventral roots; (a2) micrographs made under higher magnification of the arrow-pointed area in A showing dendritic emanation of FG-labeled neurons in the ventral horn. (B) A representative micrograph of spinal cross-sections showing FG-positive neurons (arrows) present in the ventral horn of the animals with ventral root reimplantation (VRI) plus lithium treatment. (b1) Micrographs made under higher magnification of the rectangular area in B showing that FG-labeled neurons extended their axons into the replanted ventral roots; (b2) micrographs made under higher magnification of the arrow-pointed area in B showing dendritic emanation of FG-labeled neurons in the ventral horn. (C) A representative micrograph of spinal cross-sections showing FG-positive neurons (arrows) present in the ventral horn of the animals with ventral root reimplantation (VRI) plus SB injection. (c1) Micrographs made under higher magnification of the rectangular area in C showing that FG-labeled neurons extended their axons into the replanted ventral roots; (c2) micrographs made under higher magnification of the arrow-pointed area in C showing dendritic emanation of FG-labeled neurons in the ventral horn. (D) The number of regenerating motoneurons that extended axons into replanted ventral roots in the lithium-treated animals was significantly higher than that in the saline control animals (*P < 0.001). (E) The number of dendritic emanation from regenerating motoneurons in the lithium-treated animals was significantly higher than that in the saline control animals (# P < 0.05). Scale bar: 180 μm in A, B, and C; 75 μm in (a1), (a2), (b1), (b2), (c1), and (c2).
