
Figure 5.
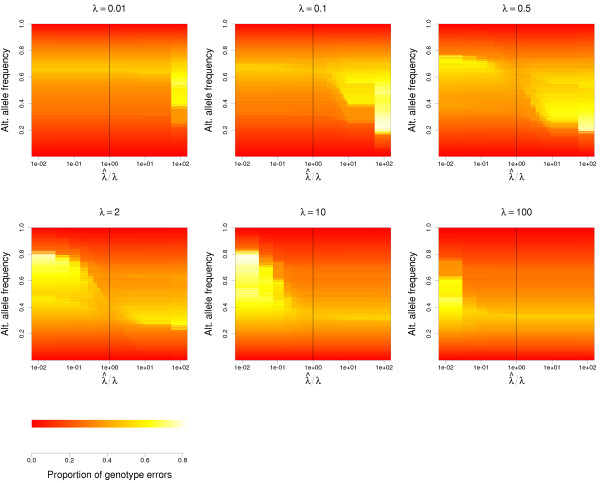
Effect of the allele sampling bias on the accuracy of the most probable genotypes. The heatmap represents the observed accuracy of the most probable genotypes in simulated datasets, as a function of the allele sampling bias (λ, above each plot), the ratio between the estimated and the true allele sampling bias (), and the frequency of the alternative allele. Each combination of real and estimated λ values is simulated 1000 times, using 500 individuals sequenced at 4 × coverage and a random allele frequency.