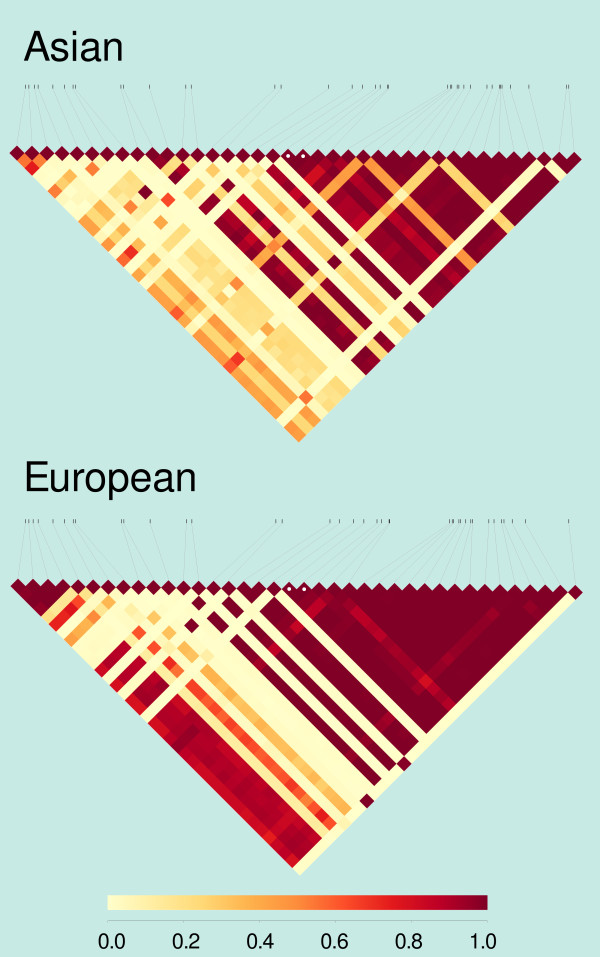
Figure 7.

Linkage disequilibrium patterns around inversion HsInv0201 in Asian and European populations. The heatmap represents values of r2, a measure of linkage disequilibrium between pairs of SNPs or between SNPs and the breakpoints of inversion HsInv0201. The two breakpoints are marked with white spots. The SNP positions span chromosome 5 (hg19) bases 147549663 to 147556698 in Asians, and 147549507 to 147556942 in Europeans.
