
FIGURE 3:
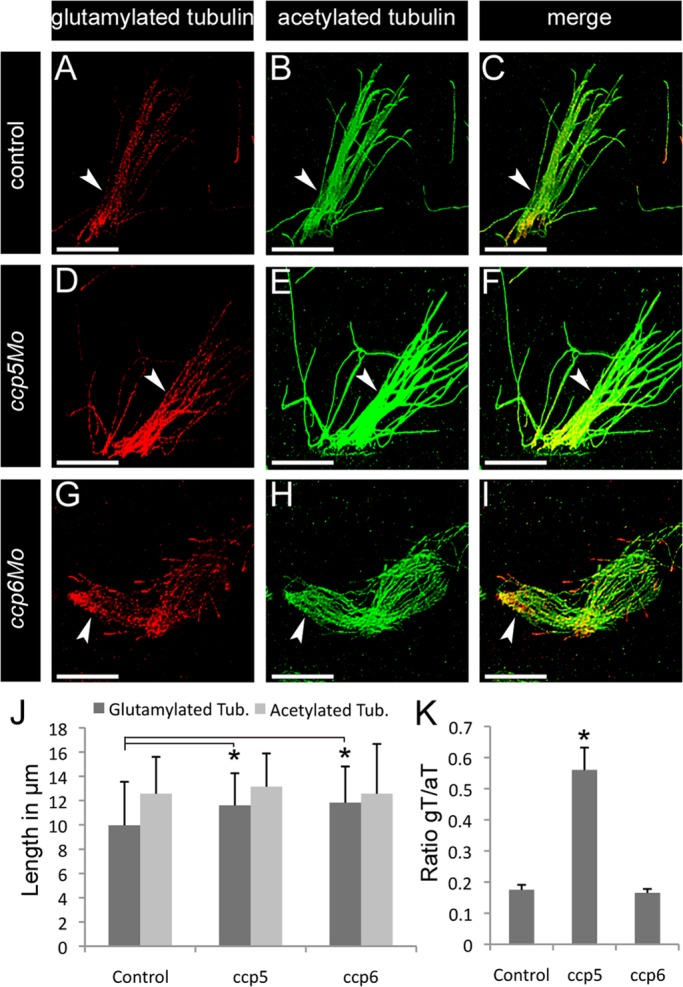
ccp5 knockdown induced hyperglutamylation of cilia microtubules. Representative images of pronephric cilia from 2.5-d-old zebrafish larvae double immunolabeled with glutamylated tubulin–specific mAb GT335 (red) and acetylated tubulin–specific mAb 6-11B-1 (green), Scale bars, 10 μm. (A–C) Pronephric multicilia (arrowheads) from control larva showing that (A) glutamylated tubulin normally decreases from the base to the tip of axonemes, in contrast to (B) uniformly distributed acetylated tubulin. (D–F) Pronephric multicilia from ccp5 morphant larva showing (D) enhanced labeling intensity of glutamylated tubulin along their axonemes marked by (E) acetylated tubulin. (G–I) Pronephric multicilia from ccp6 morphant, showing that (G) labeling intensity of glutamylated tubulin along their axonemes marked by (H) acetylated tubulin is similar to control. (J) Average length of glutamylated tubulin labeled segment increased in the pronephric cilia of ccp5 and ccp6 morphants relative to controls, although length of their acetylated tubulin-labeled segments was similar. Control (n = 33, cilia/4 larvae), ccp5 morphants (n = 42 cilia/4 larvae), ccp6 morphants (n = 31 cilia/4 larvae). Error bars, SD; t test, *p < 0.05. (K) Average intensity ratio of glutamylated tubulin relative to acetylated tubulin significantly increased in pronephric cilia of ccp5 morphants relative to control or ccp6 morphants. n = 36 cilia/4 control larvae; 33 cilia/4 ccp5 morphant larvae; 45 cilia/4 ccp6 morphant larvae. Error bars, SEM; t test, *p < 0.05.