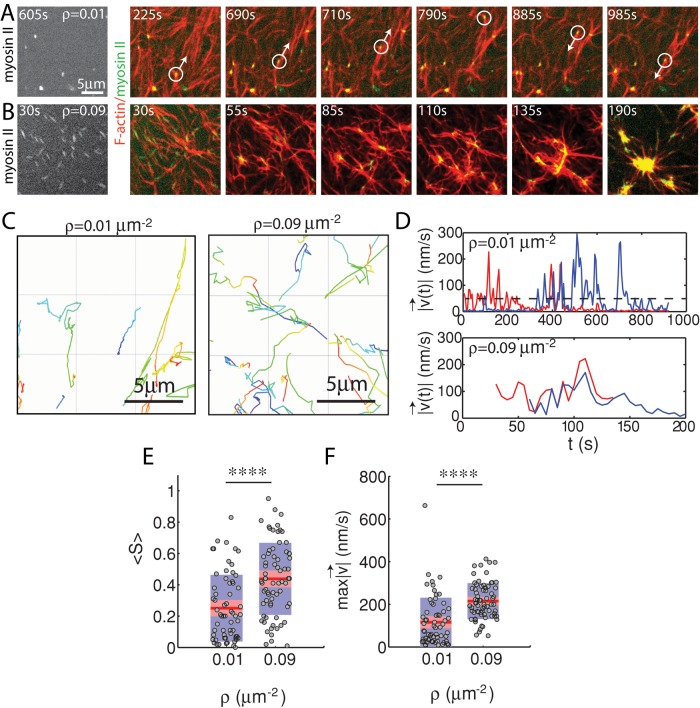
FIGURE 4:
Myosin motion in strongly and weakly contractile networks. Overlay of F-actin (red) and myosin (green) at myosin density (A) ρ = 0.01 and (B) 0.09 μm−2 (Rxlink = 0, Radh = 0). White circle highlights an individual myosin thick filament within the F-actin network. White arrow indicates the direction of movement. Myosin polymerized at 0 s. (C) Trajectories of myosin thick filaments within F-actin network (left) at ρ = 0.01 and (right) at 0.09 μm−2. Color indicates time, from purple to yellow. (D) Instantaneous speeds for two selected myosin thick filaments embedded within the samples in A and B. The dotted line represents our minimum threshold for identifying moving myosins of 50 nm/s. (E) Mean straightness, S, and (F) maximum velocity over the course of a myosin trajectory for equivalent time frames (p < 0.0001). For ρ = 0.09 μm−2, the times were between 0 and 450 s to encompass the times over which contraction into dense foci occurred. For ρ = 0.01 μm−2, time was taken from 535 to 985 s to confirm that steady state had been achieved.

