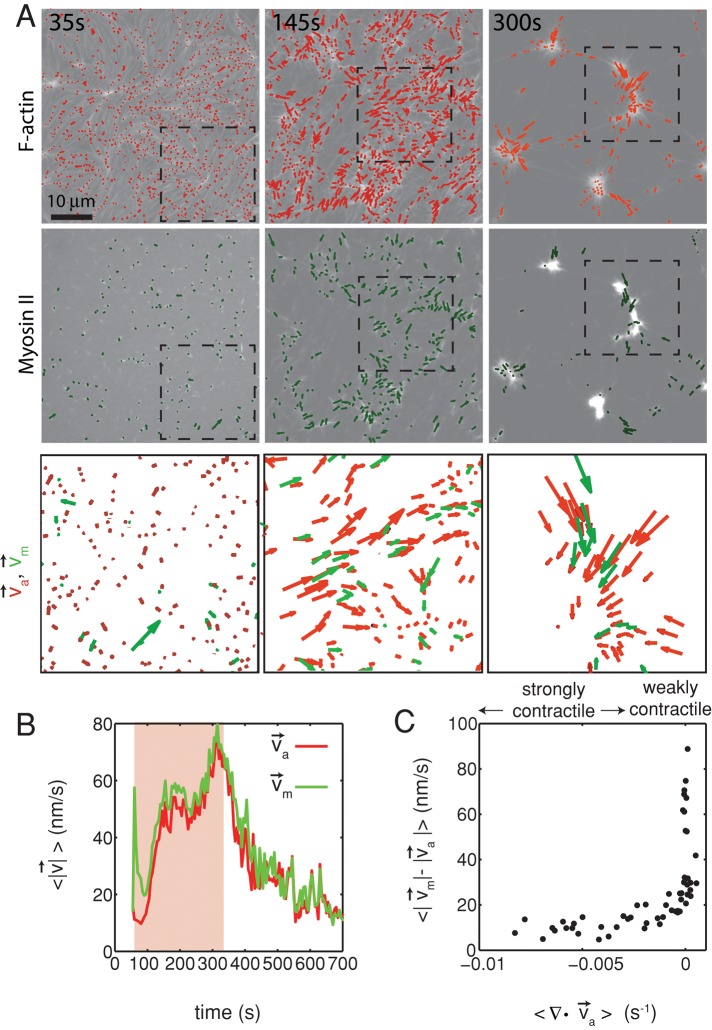
FIGURE 5:
Relative actomyosin motion decreases during contraction. (A) Contraction of a cross-linked F-actin network (Rxlink = 0.003, Radh = 0) and corresponding F-actin velocity vectors (top), myosin II thick filament density of ρ = 0.15 μm−2 and corresponding myosin velocity vectors (middle), and an overlay of F-actin and myosin velocity vectors (bottom). The dotted squares in the top and middle are zoomed in on the bottom. This is the same experiment as that in Figure 2. (B) Average velocity for F-actin (red) and myosin (green) puncta during contraction. Shaded region indicates time over which contraction of the network occurs, before foci coalescence. (C) The average relative speeds between individual myosin and F-actin (interpolated onto the myosin position) as a function of the F-actin network contraction. Each dot pertains to the average of the relative motions between actin and myosin velocity vectors (for  > 50 nm/s), and the mean divergence of the F-actin velocity vector field at each point in time, as indicated in B and Figure 2B. The data are taken between 60 and 330 s (shaded region in B).

