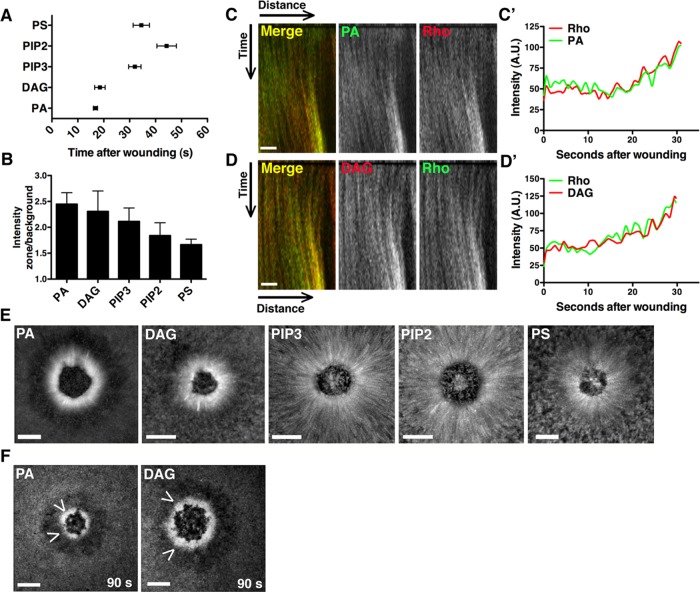
FIGURE 2:
PA and DAG are generated at the wound edge coincident with Rho GTPase activation. (A) Recruitment times for each lipid were quantified. PA appeared at 16.8 s, and DAG at 18.5 s, whereas PIP3, PIP2, and PS accumulated at ≥32 s (PA, n = 10; DAG, n = 12; PIP3, n = 12; PIP2, n = 8; PS, n = 8; error bars, SEM). (B) The ratio of zone/background fluorescence intensity was calculated for each lipid at 90 s (PA, PIP3, n = 6; DAG, PIP2, PS, n = 5; error bars, SEM). (C) Cells injected with mCherry-rGBD and eGFP-Spo20 were wounded. A kymograph shows corecruitment of active Rho and PA to the wound edge. (C′) The intensity/time plotted from a vertical line drawn through the wound edge in C. (D) Cells injected with eGFP-rGBD and mRFP-C1 were wounded. A kymograph shows corecruitment of active Rho and DAG to the wound edge. (D′) Intensity/time plotted from a vertical line drawn through the wound edge in D. (E) Brightest-point projections from movies show the contribution of cortical flow (indicated by lines perpendicular to the wound edge) to enrichment of each lipid. PA and DAG are less dependent on cortical flow than PIP3, PIP2, and PS. (F) Cells were treated with latrunculin A to abolish actin-mediated cortical flow, but PA and DAG still accumulated, as indicated by arrowheads. Scale bar, 10 μm (C, D); 20 μm (E, F).

