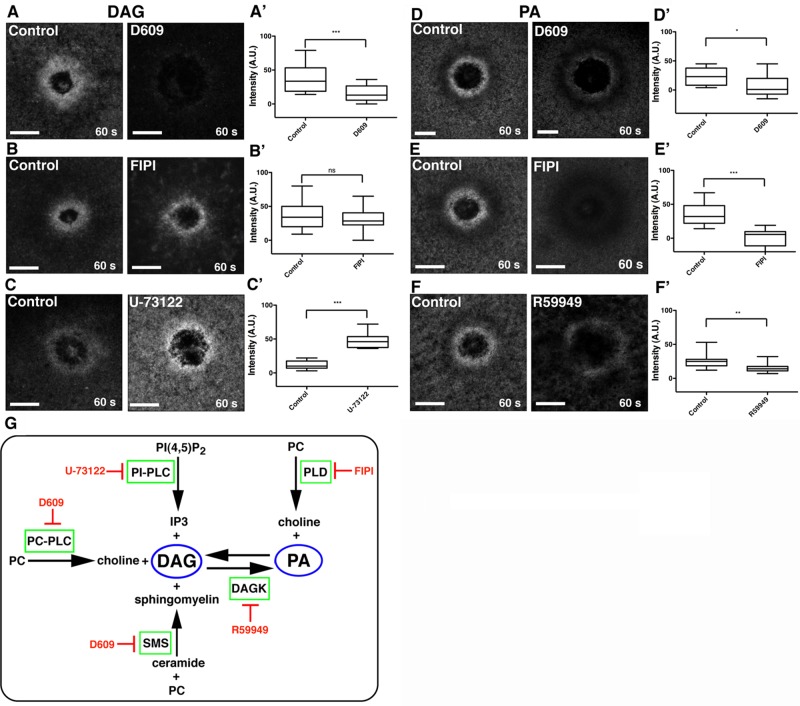
FIGURE 3:
DAG is generated via the PC-PLC/SMS pathway, whereas PA is generated via PLD and DAG kinase. (A) DAG is present at wounds in control cells but blocked by the PC-PLC/SMS inhibitor D609. (A′) Quantification of wound DAG (***p < 0.005). (B) DAG is present at similar levels at wounds in control cells and those treated with FIPI, a PLD inhibitor. (B′) Quantification of wound DAG (p > 0.05). (C) DAG at wounds is elevated in cells treated with the PIP2-PLC inhibitor U-73122. (C′) Quantification of wound DAG (***p < 0.005). (D) PA is decreased in cells treated with D609 relative to controls. (D′) Quantification of wound PA (*p < 0.05). (E) PA wound signal is blocked in cells treated with FIPI. (E′) Quantification of wound PA (***p < 0.005). (F) PA levels at wounds are decreased in cells treated with R59949, a DAG kinase inhibitor. (F′) Quantification of wound PA (**p < 0.01). (G) Schematic of pathways leading to DAG and PA generation and corresponding inhibitors. Top and bottom whiskers represent maximum and minimum values, respectively. Scale bar, 20 μm.

