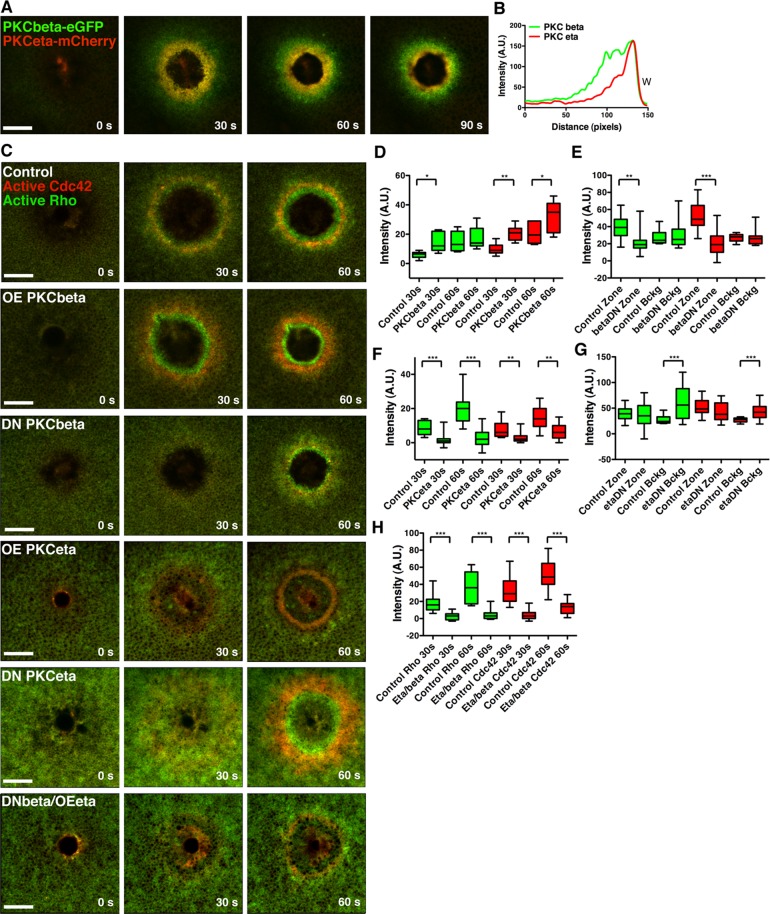
FIGURE 7:
PKCβ and PKCη differentially regulate Rho and Cdc42 zones. (A) Cells injected with PKCβ -eGFP and PKCη-mCherry reveal localization of both PKCs to the wound edge, with PKCβ spanning a broader region than PKCη. (B) A line scan from the 90-s time point of A. (C) Cells were injected with eGFP-rGBD and mRFP-wGBD alone or with PKCβ, DN PKCβ, PKCη, DN PKCη, or DN PKCβ and PKCη. PKCβ up-regulates Rho and Cdc42 activity zones, whereas DN PKCβ down-regulates zones. PKCη inhibits Rho and Cdc42 activity zones, whereas DN PKCβ up-regulates Rho and Cdc42 activity on the cortex. Expression of DN PKCβ and full-length PKCη results in dramatic inhibition of both Rho and Cdc42 activity zones. (D) Quantification of Rho and Cdc42 zone intensity at 30 and 60 s with PKCβ expression (control, n = 6; PKCβ, n = 7). (E) Quantification of Rho and Cdc42 zone intensity at 60 s and background intensity with DN PKCβ expression (control, n = 16; PKCβ DN, n = 11). (F) Quantification of Rho and Cdc42 zone intensity at 30 and 60 s with PKCη expression (n = 14). (G) Quantification of Rho and Cdc42 zone intensity at 60 s and background intensity with DN PKCη expression (control, n = 16; PKCη DN, n = 11). (H) Quantification of Rho and Cdc42 zone intensity at 30 and 60 s with expression of DN PKCβ and full-length PKCη (control, n = 16, PKCβ DN/PKCη, n = 13). Green bars, Rho; red bars, Cdc42. Top and bottom whiskers represent maximum and minimum values, respectively. Scale bar, 20 μm. W, wound.

