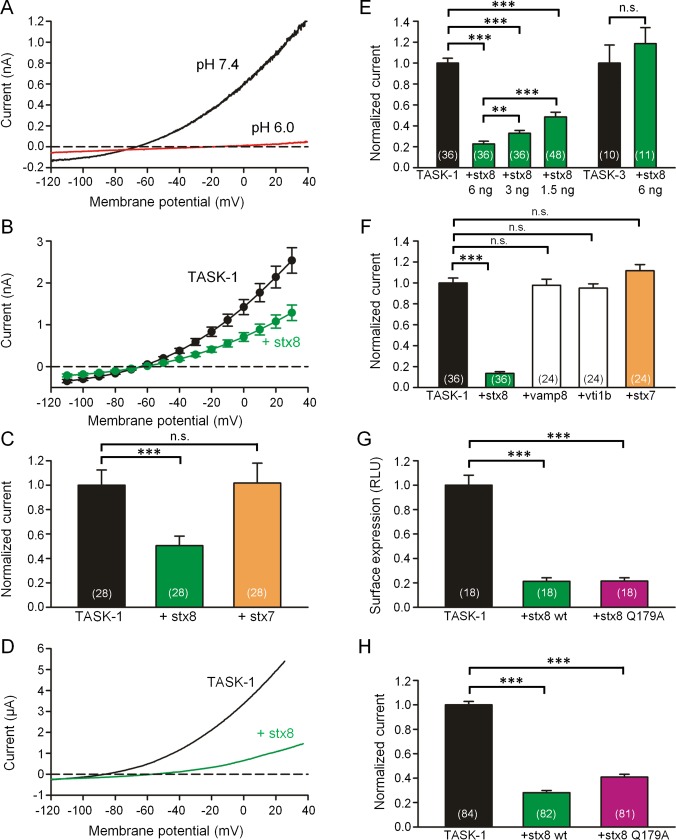
FIGURE 2:
Coexpression of TASK-1 with stx8 or stx7 in CHO cells and Xenopus oocytes. (A) Current–voltage relation of rTASK-1 expressed in CHO cells. The currents were measured using voltage ramps from −120 to +40 mV at pH 7.4 (black curve) and 6.0 (red curve). (B) TASK-1 current–voltage relation measured in the same batches of CHO cells 48 h after transfection of TASK-1 alone (black curve) and after cotransfection of TASK-1 with stx8 (green curve); mean values ± SEM of n = 28 cells. (C) Mean outward currents ± SEM measured in CHO cells at 0 mV after transfection with rat TASK‑1 alone (black) and after cotransfection of TASK-1 with stx8 (green) or stx7 (orange). (D) Typical current–voltage relation measured 48 h after injection of human TASK-1 cRNA (black curve) and after coinjection of TASK-1 and stx8 cRNA. For experiments with human TASK-1 we used the NQTASK-1 mutant, which displays a higher current amplitude (Zuzarte et al., 2009; Materials and Methods). (E) Mean outward currents ± SEM measured in Xenopus oocytes at 0 mV after injection of hTASK‑1 or hTASK-3 cRNA alone (black) or together with 1.5, 3, or 6 ng stx8 cRNA per oocyte as indicated. (F) Mean outward currents ± SEM measured in Xenopus oocytes at 0 mV measured after injection of hTASK‑1 cRNA alone (black) or together with 6 ng cRNA encoding stx8, VAMP8, vti1b, or stx7. (G) Mean surface expression of HA-tagged hTASK-1 channels (measured in relative light units [RLUs]) in Xenopus oocytes after injection of TASK-1 cRNA alone or together with 6 ng of stx8 or stx8Q179A. (H) Mean hTASK-1 current measured in Xenopus oocytes after injection of hTASK-1 cRNA alone or together with stx8 or stx8Q179A. In all bar graphs the number of oocytes or CHO cells from which the data were obtained is indicated in brackets. Note that in the series of experiments shown in E, F, and H, coinjection of 6 ng of stx8 cRNA caused a reduction of TASK-1 current to values between 13 and 23% of control, illustrating that there was a certain degree of variability among different batches of oocytes. For this reason, TASK-1 (and other) currents with and without coinjection of a second cRNA were always compared in the same batch of oocytes (measured on the same day); normalized current amplitudes of at least three different batches are combined in the bar graphs.

