FIGURE 7:
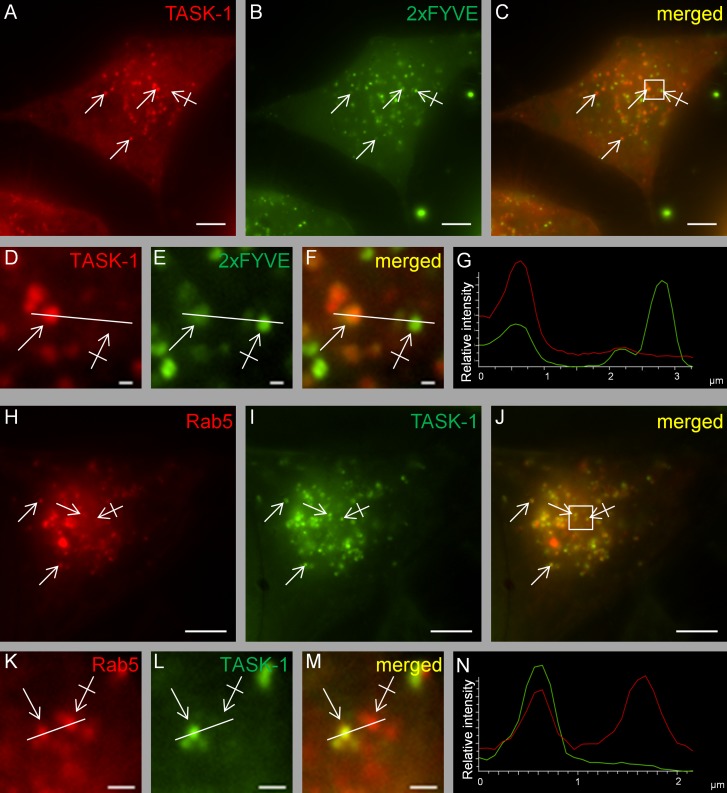
Live-cell imaging of HeLa cells cotransfected with fluorescence-labeled TASK-1 and the endosomal marker 2xFYVE or rab5. (A–G) Cotransfection of mCherry-tagged TASK-1 and EGFP-tagged 2xFYVE. Similar results were obtained in n = 3 transfections. Plain arrows indicate colocalization; crossed arrows indicate lack of colocalization. (H–N) Cotransfection of mCherry-tagged rab5 and EGFP-tagged TASK-1. (D–F, K–M) Higher magnifications of the regions indicated by the squares in C and J. (G, N) Intensity profiles of F and M (green line, EGFP; red line, mCherry/DsRed). All images were taken 48 h after transfection. Similar results were obtained in n = 3 transfections. Scale bars, 5 μm (A–C, H–J), 1 μm (D–F, K–M).

