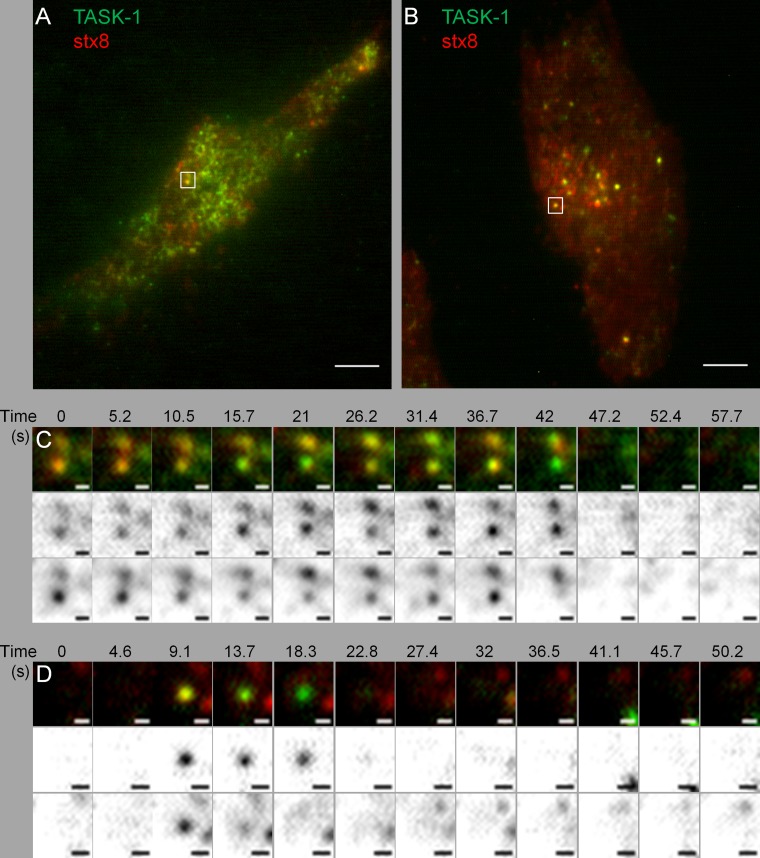
FIGURE 8:
TIRF microscopy of TASK-1 and stx8. (A, B) HeLa cells transfected with EGFP-tagged hTASK-1 and mCherry-tagged stx8; scale bars, 5 μm. (C) Sequence of TIRF images taken from the cell shown in A; scale bars, 0.5 μm. The two bottom rows show the red and green channels (Materials and Methods). TASK-1 and stx8 are colocalized in diffraction-limited spots for at least 37 s. (D) Sequence of TIRF images taken from the cell shown in B; scale bars, 0.5 μm. The two bottom rows show the red and green channels (Materials and Methods). TASK-1 and stx8 are colocalized in diffraction-limited spots for at least 4.6 s.

