
Figure 4.
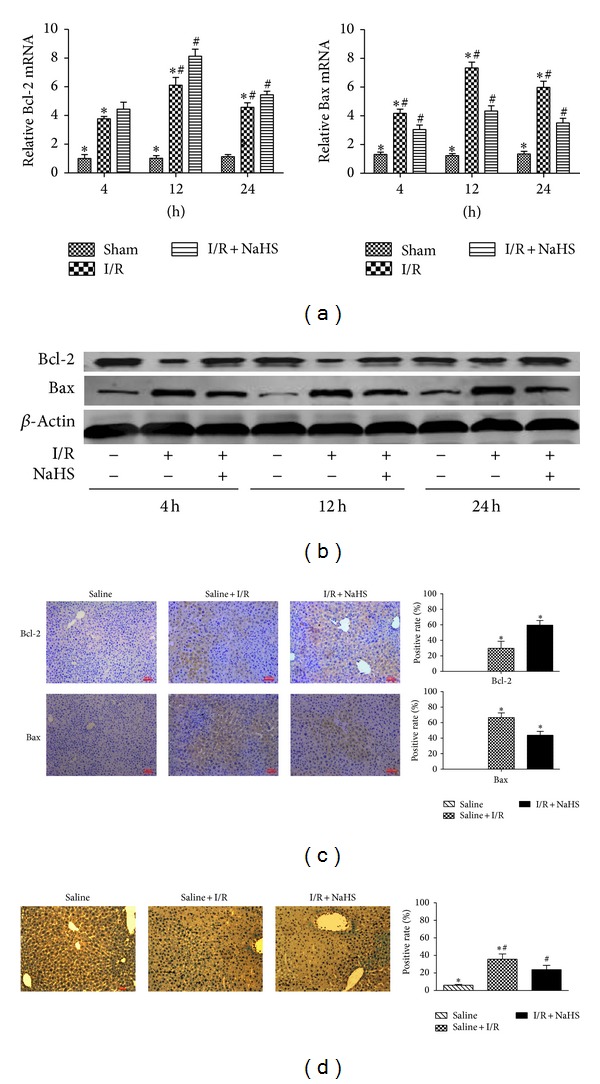
Effect of NaHS pretreatment on regulation of apoptosis in vivo. (a) The mRNA expression of Bcl-2 and Bax in liver tissues was detected by real time PCR. *P < 0.05 for saline versus saline + I/R, # P < 0.05 for saline + I/R versus I/R + NaHS (14 μmol/kg). (b) Western blots and quantitative evaluation of the expression of Bcl-2 and Bax in liver tissues. *P < 0.05 for saline versus saline + I/R,# P < 0.05 for saline + I/R versus I/R + NaHS (14 μmol/kg). (c) Immunohistochemistry staining (200x) showed the expression of Bcl-2 and Bax in liver tissue at 12 h. *P < 0.05 for saline + I/R versus I/R + NaHS. (d) TUNNEL staining showed the apoptotic cells in three groups at 12 h. Original magnifications: ×200. *P < 0.05 for saline versus saline + I/R, # P < 0.05 for saline + I/R versus I/R + NaHS.