
Figure 6.
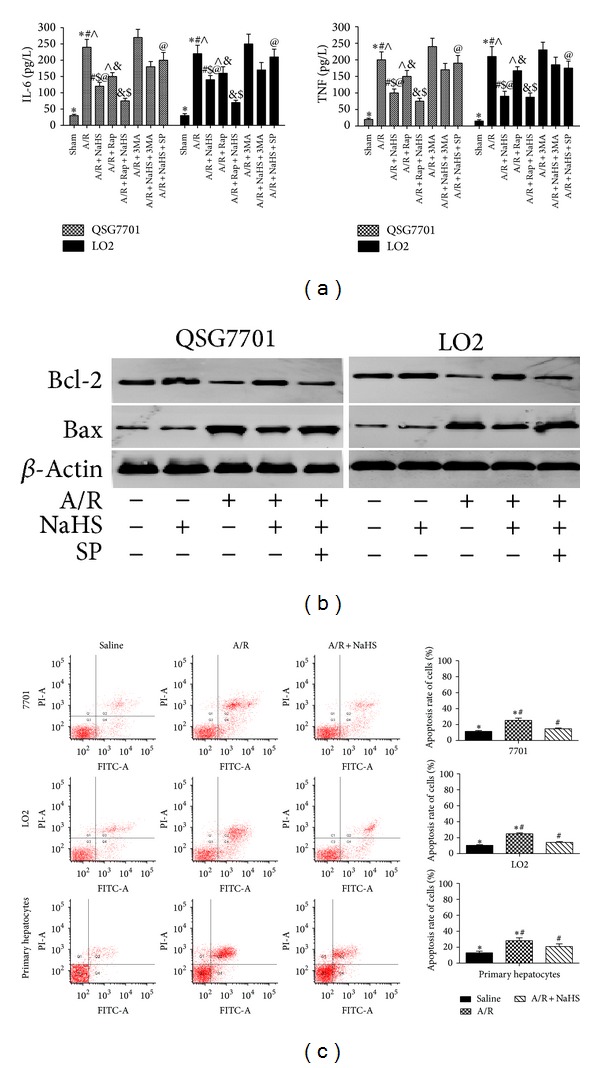
Effect of NaHS pretreatment on regulation of apoptosis in vitro. (a) IL-6 and TNF levels were assessed by ELISA. Data are expressed as mean ± SD of 5 wells nutrient solution per group. *Significant difference from control, P < 0.05; #significant difference from A/R group, P < 0.05; ∧ P < 0.05 for A/R versus A/R + Rap; $ P < 0.05 for A/R + NaHS versus A/R + NaHS + Rap; @ P < 0.05 for A/R + NaHS versus A/R + NaHS + SP. (b) Western blots of the expression of Bcl-2 and Bax in vitro that were subjected to saline, A/R, A/R + NaHS, and A/R + NaHS + SP with β-actin as protein loading control. (c) Flow cytometric analyses of annexin-V/PI staining of hepatocytes (LO2, QSG7701, and primary hepatocytes). *P < 0.05 for saline versus saline + A/R, # P < 0.05 for saline + A/R versus A/R + NaHS.