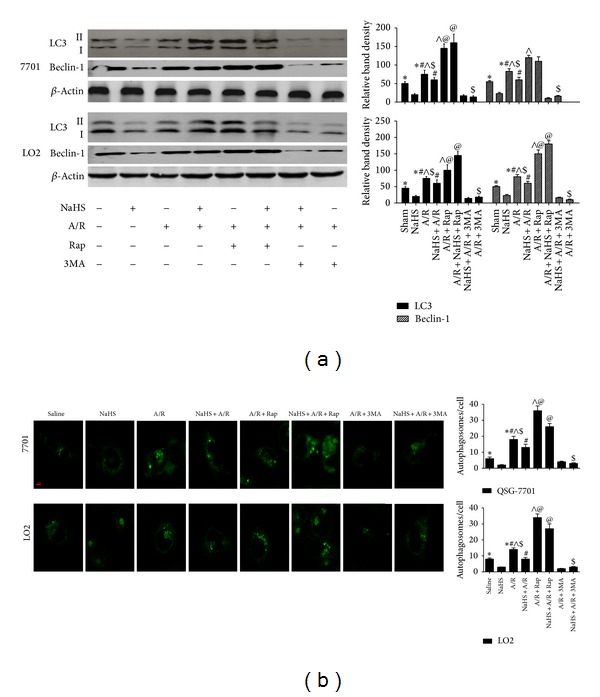
Figure 7.

Effect of NaHS pretreatment on regulation of autophagy in vitro. (a) Western blots and quantitative evaluation of the expression of Beclin-1 and LC3 in vitro with β-actin as protein loading control. *Significant difference from control, P < 0.05; #significant difference from A/R group, P < 0.05; ∧ P < 0.05 for A/R versus A/R + Rap; $ P < 0.05 for A/R + NaHS versus A/R + NaHS + Rap; @ P < 0.05 for A/R + NaHS versus A/R + NaHS + SP. (b) The average number of autophagosomes/cell ± SD counted from confocal microscopy images of hepatocytes (LO2, QSG7701) expressing GFP-LC3. (Original magnifications: ×400.)
