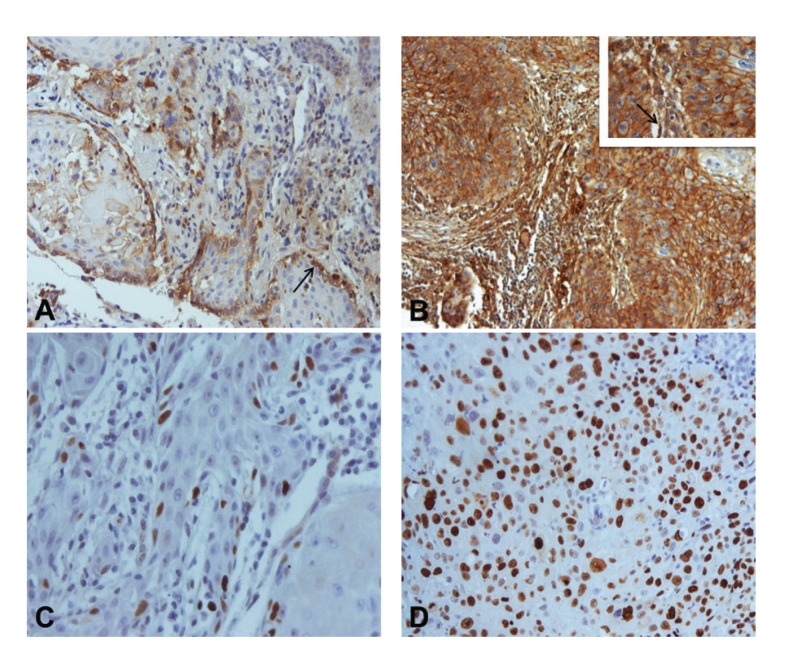
Figure 1.
Immunohistochemical expression of EMMPRIN and Ki-67 in oral squamous cell carcinomas: (A) EMMPRIN score 1+ expression with predominantly peripheral distribution pattern (arrow) (×200); (B) EMMPRIN score 3+ expression with staining homogeneously distributed by the tumor islands (×100). Inset: higher magnification (×400). Note peritumoral fibroblast staining (arrow); (C) Ki-67 expression in less than 50% of tumor cells (×400); (D) Ki-67 expression in more than 50% of tumor cells (×400).

