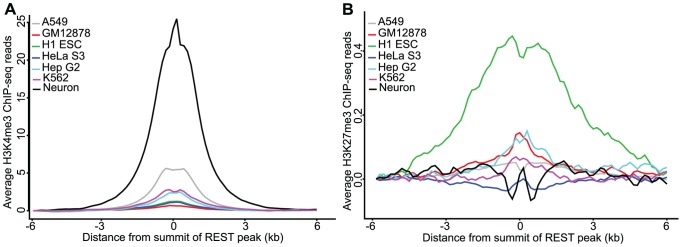
Figure 5. Histone modification profiles at REST peaks.

Profiles of (A) H3K4me3 and (B) H3K27me3 ChIP-seq signal at REST peaks in GM12878 cells, H1 ESCs, neurons, A549, HeLa S3, Hep G2, and K562 cells. Y-axis shows the read density from Zhu et. al. [68] or ENCODE [34] per 150 bp averaged over REST-bound peaks in each cell type from −6 kb to 6 kb of the peak summits. Data were normalized to a read depth of 5 million mapped reads.
