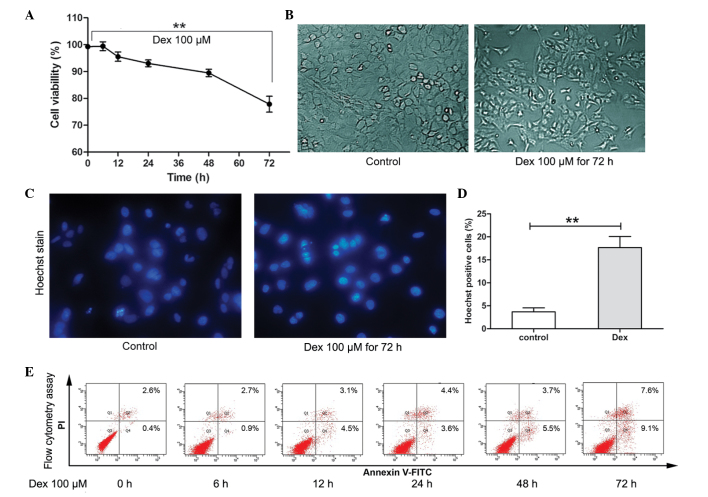
Figure 1.
Inhibition rate and induction of apoptosis in human chondrocytes treated with Dex. (A) At different times of Dex treatment, the cell viability index (%) of six groups was assessed using the CCK-8 assay. The results are expressed as the mean ± SD and significant differences are indicated by asterisks (**P<0.01). (B) Morphological changes were observed by inverted microscopy (magnification, ×200). (C) Following Dex treatment for 72 h, apoptotic cells were stained with Hoechst 33342 and visualized by fluorescence microscopy (magnification, ×400). (D) Hoechst-positive cells (bright blue with nuclear fragmentation) are expressed as the mean ± SD and significant differences are indicated by asterisks (**P<0.01, vs. control). (E) Percentage of apoptotic cells following Dex treatment for different periods of time. The apoptotic index was determined by flow cytometry following Annexin V-FITC and PI staining. Dex, dexamethasone; FITC, fluorescein isothiocyanate; SD, standard deviation; PI, propidium iodide.

