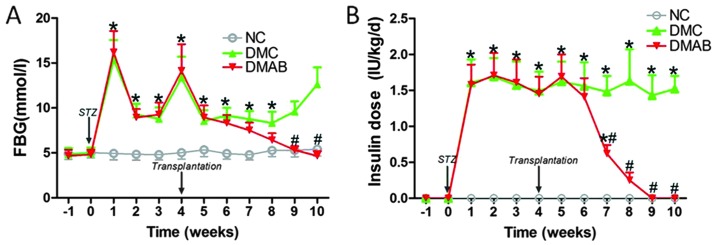
Figure 2.

Marked changes of fasting blood glucose (FBG) and insulin dosage over time in different groups. Time-course panels had significant effects of treatment and time by two-way analysis of variance (ANOVA) followed by Bonferroni group comparisons. For all panels: *P<0.05 vs. normal controls (NC) group; #P<0.05 vs. diabetic minipig control group (DMC).
