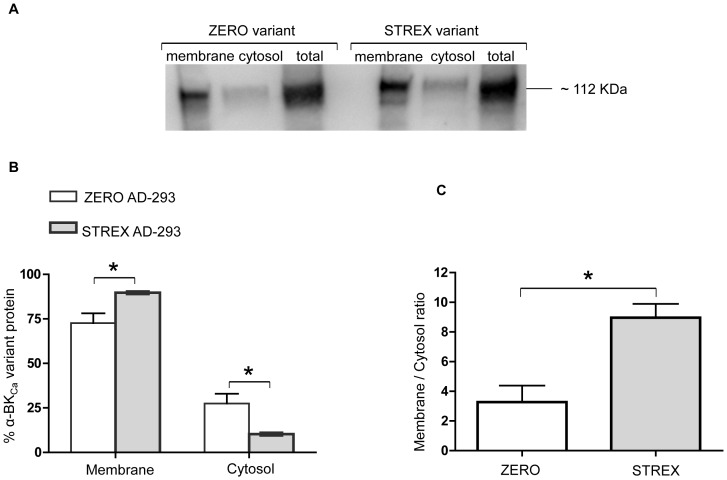
Figure 4. The cell surface and cytosolic expression of BKCa α-subunit splice variants in cultured cells.
Using an AD-293 cell culture system, α-BKCa STREX variant shows a significantly higher cell surface expression compared with the ZERO variant. Corresponding changes in the cytosolic fraction are observed. (A) Representative Western blot showing membrane, cytosolic, and total levels of α-BKCa protein in AD-293 cultured cells, transfected with either α-BKCa splice variants ZERO or STREX. (B) Summary of membrane vs cytosolic distribution of transfected ZERO or STREX variants of α-BKCa channel protein (expressed as % of total α-BKCa protein). (C) Membrane to cytosolic expression ratio of ZERO and STREX variants in transfected cultured AD-293 cells. Results are shown for n = 4 separate experiments and are presented as mean ± SEM (*P<0.05, unpaired t-test).

