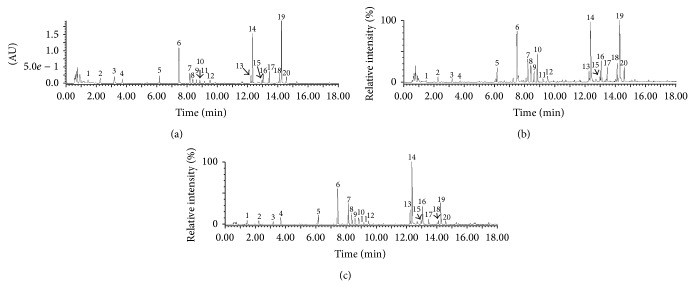
Figure 1.
Chromatograms of EEJ analyzed by UPLC-DAD/Q-TOF-MS. (a) UV chromatogram of EEJ (scanned from 190 nm to 400 nm). (b) TIC chromatogram of EEJ in positive ion mode. (c) TIC chromatogram of EEJ in negative ion mode. Peak numbers are consistent with those shown in Table 1.

