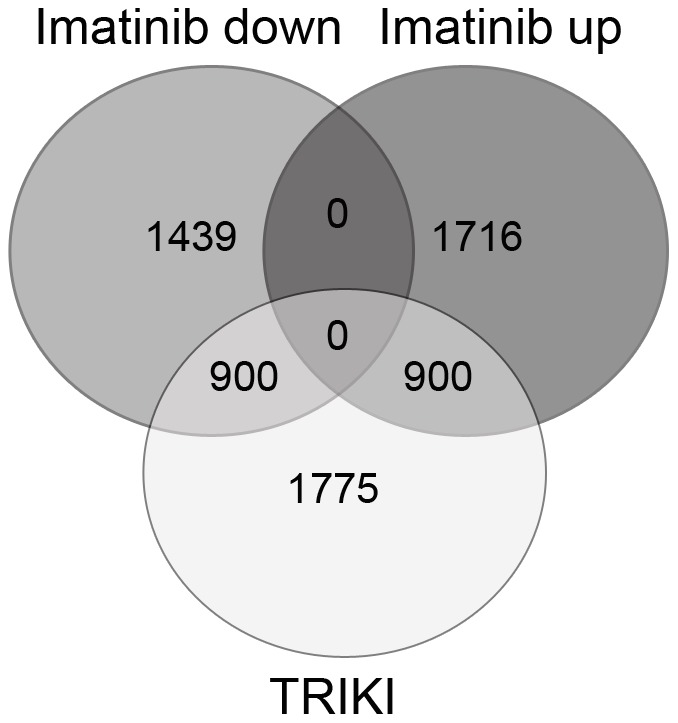
Figure 6. Venn diagram of genes down- or up-regulated following Imatinib or TRIKI treatment.

Merging analyses represented by a Venn diagram of the intersections of significant differentially transcribed down- or up-regulated genes following Imatinib treatment with those differentially (up- and down-) regulated upon TRIKI treatment [47]. The direction of regulation following Imatinib treatment (down/up) is shown within the header. Given numbers correlate with the numbers of significant differentially transcribed genes for these data sets (see text). The overlapping regions of the circles contain the corresponding differentially transcribed genes in these data sets.
