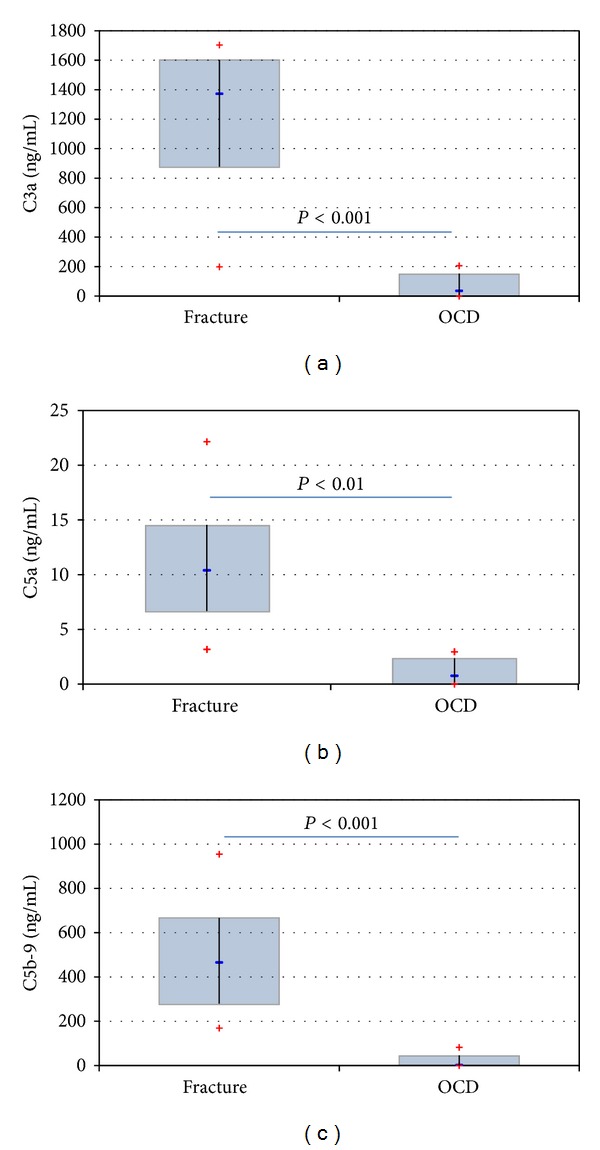
Figure 2.

Showing the comparison of C3a levels ((a) P = 0.0003), C5a levels ((b) P = 0.0018) and C5b-9 levels ((c) P = 0.0013) in patients with ankle dislocation fractures and patients suffering from an OCD grade 2. The difference was statistically significant for all comparisons.
