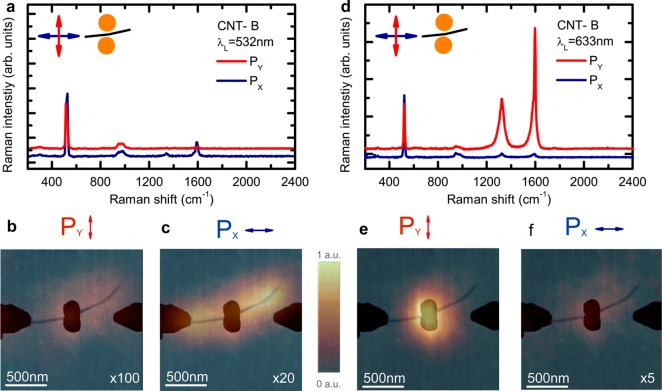
Figure 4.
(a) Raman spectra of CNT-B for an excitation of 532 nm for Py (red) and Px (blue). Corresponding Raman maps of the integrated G-peak intensity are depicted in (b) and (c), respectively. (d) Raman spectra for an excitation of 638 nm for Py (red) and Px (blue). Corresponding Raman maps of the integrated G-peak intensity are shown in (e) and (f), respectively. A scaling factor relative to the map in (e) is given within the panels.

