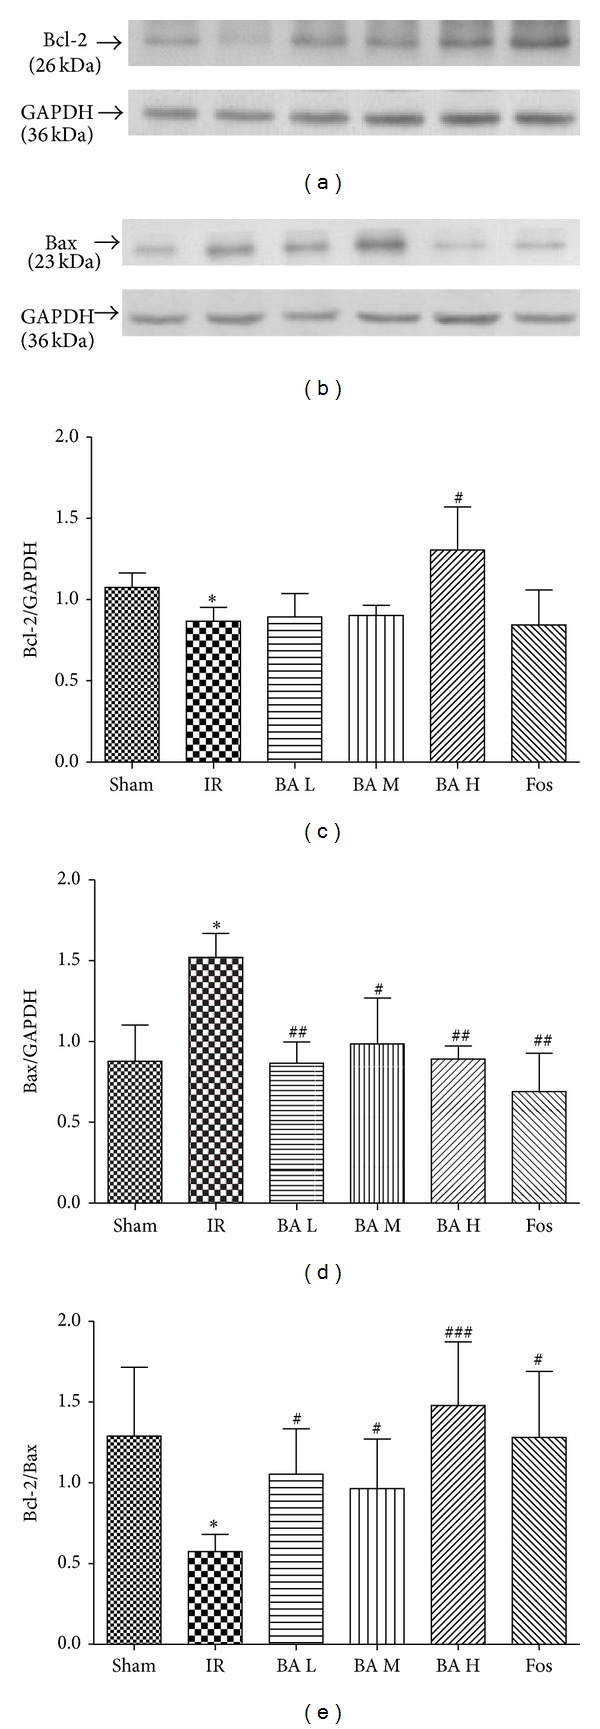
Figure 6.

Expression of Bcl-2 (a) and Bax (b) by Western blot analysis. (c) Quantification of the Bcl-2/GAPDH. (d) Quantification of the Bax/GAPDH. (e) Quantification of the Bcl-2/Bax (mean ± SD, n = 3). *P < 0.05 versus Sham group; # P < 0.05, ## P < 0.01, ### P < 0.001 versus IR group.
