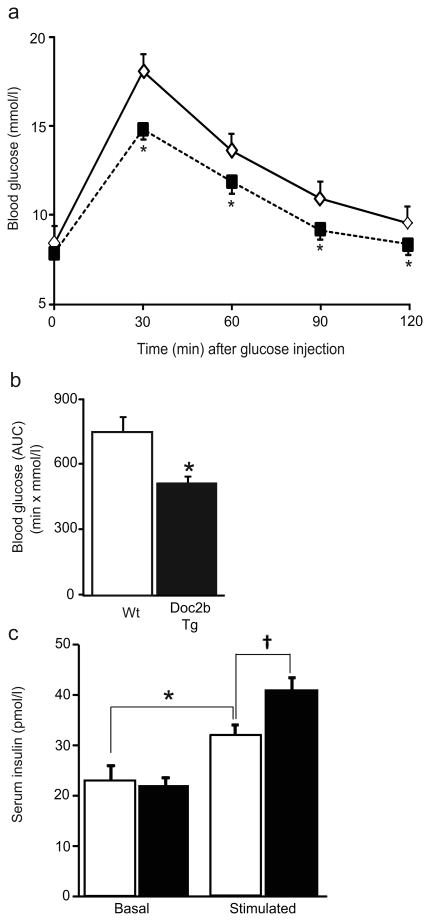
Fig. 2.
Doc2b Tg mice have enhanced glucose tolerance. (a) IPGTT in Doc2b Tg mice (black squares) and Wt littermates (white diamonds) was performed in 4- to 6-month-old female mice fasted for 6 h. (b) AUC data are shown as the average ± SE from seven pairs of mice; *p<0.05, vs Wt. (c) Insulin content present in serum taken before (Basal) and 10 min post injection of glucose (Stimulated) during the IPGTT in Doc2b Tg (black bars) and Wt mice (white bars). Data represent the average ± SE from six pairs of mice; *p<0.05 vs Wt basal; †p<0.05 vs Wt glucose-stimulated

