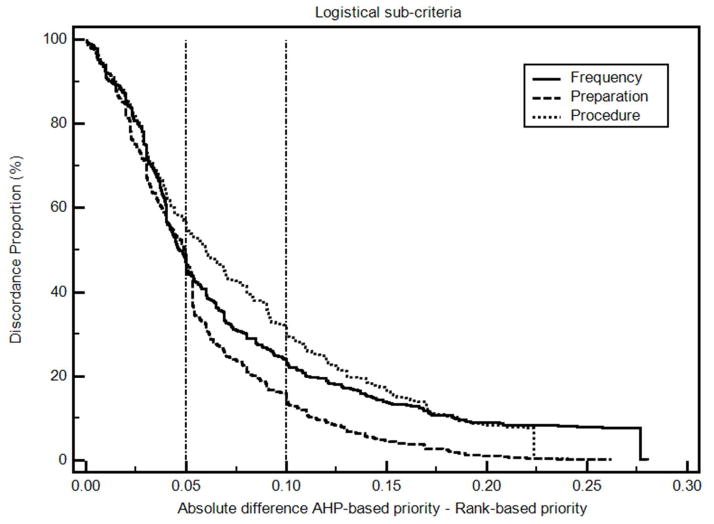
Figure 4. Discordance-proportion plot, logistical sub-criteria.
The discordance proportion refers to the proportion of differences that equal or exceed the value on the x-axis. More concordant measurements will have curves farther to the left of this graph. More discordant measures will have curves farther to the right.

