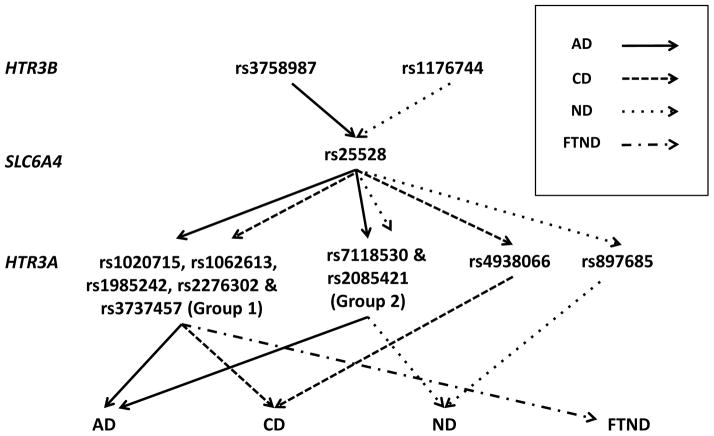
Figure 6.
Summary of detected interaction models in the SAGE AA sample. GMDR-GPU (Zhu et al. 2013) was used to perform exhaustive searches for two- to five-way interaction models. The best interaction models for AD, CD, ND, and FTND shown in the figure were determined based on CVC >7 of 10 and prediction accuracy > 55%. The P value associated for each model shown here was < 0.005 based on 107 permutation tests. Interaction models with different phenotypes involved overlapped and highly correlated SNPs, which were grouped together. Group 1 includes rs1020715, rs1062613, rs1985242, rs2276302 and rs3737457; Group 2 includes rs7118530 and rs2085421. Pair-wise D values of adjacent SNPs within each group are greater than 0.7. SNP combinations are color-coded. Dashed arrows mean the gene was not involved in the selected model.

