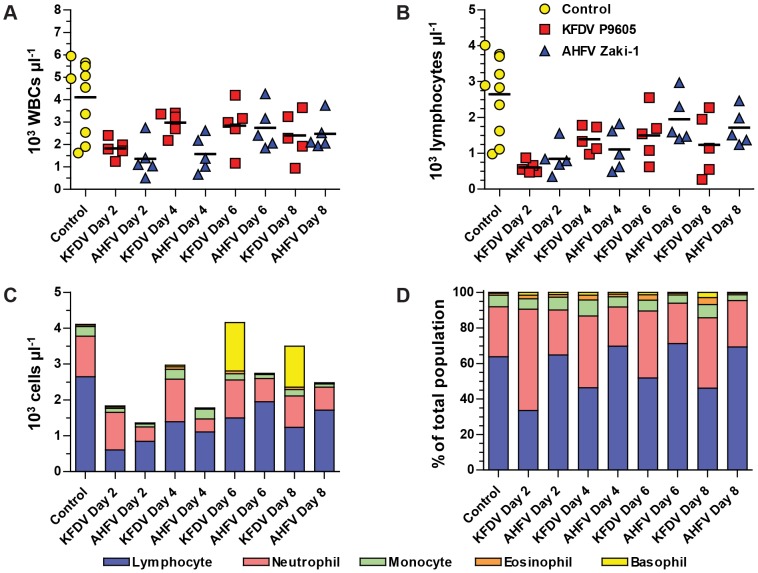
Figure 6. White blood cell (WBC) abnormalities induced by KFDV P9605 and AHFV Zaki-1 infection.
(A) Total WBC counts from whole blood. Each symbol represents one animal. (B) Lymphocyte counts from whole blood. Each symbol represents one animal. Arithmetic means in (A) and (B) are indicated by horizontal black lines. (C) Composite graph showing average absolute counts of lymphocytes, neutrophils, monocytes, eosinophils, and basophils from 5 mice per day for each virus, and 10 uninfected control animals. (D) Composite graph showing average population proportions for lymphocytes, neutrophils, monocytes, eosinophils, and basophils from 5 mice per day for each virus, and 10 uninfected control animals.

