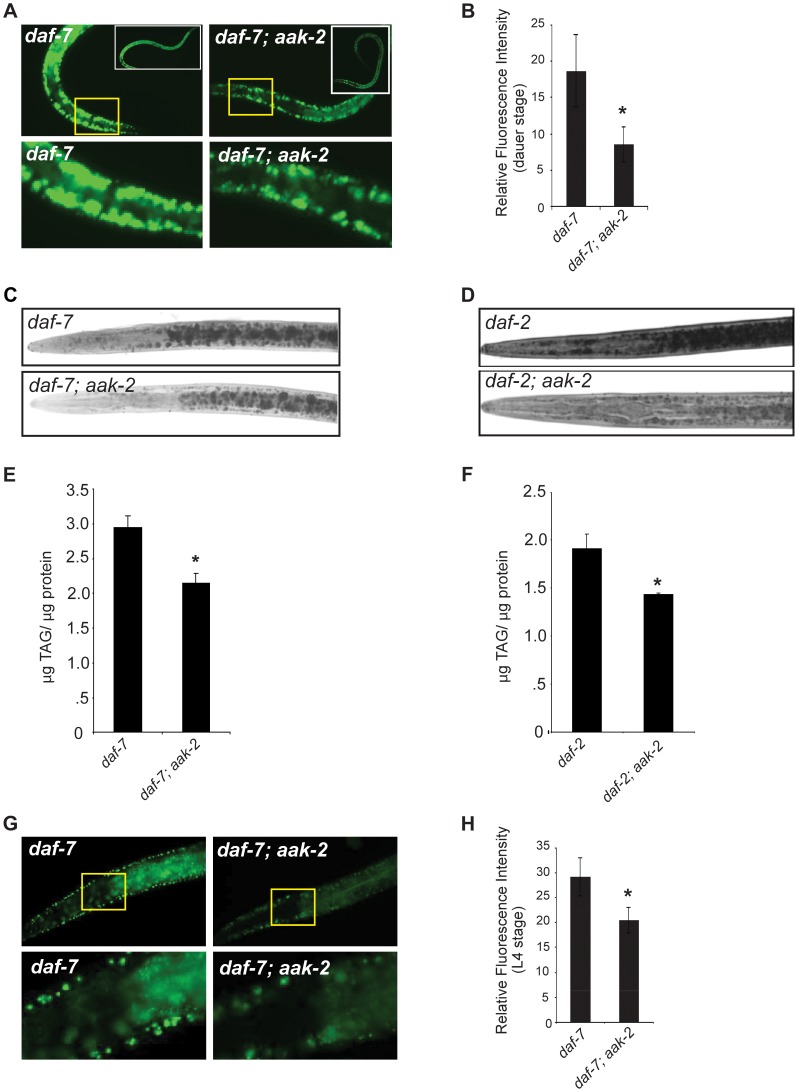
Figure 3. daf-7; aak-2 and daf-2; aak-2 have reduced fat relative to daf-7 and daf-2 at all stages of development.
A. daf-7; aak-2 dauers have significantly reduced BODIPY fluorescence relative to daf-7 on the first day after the dauer molt. Insets show entire animals and the bottom panel shows a zoomed-in selection, denoted by the yellow box, from the top panel. B. Quantification of anterior hypodermal BODIPY fluorescence for daf-7 and daf-7; aak-2 animals on the first day after the dauer molt. n = 8. * p<0.05, Student's t-test. C. Representative Sudan Black B staining of daf-7 (top) or daf-7; aak-2 (bottom) animals on the first day after the dauer molt. D. Representative Sudan Black B staining of daf-2 (top) or daf-2; aak-2 (bottom) animals on the first day after the dauer molt. E. daf-7; aak-2 animals have significantly lower TAG/protein than daf-7 animals kept at the restrictive temperature (25°C) on the first day after the dauer molt as determined by total lipid extraction followed by Thin Layer Chromatography. n = 4, * p<0.05, Student's t-test. F. daf-2; aak-2 animals have significantly lower TAG/protein than daf-2 animals kept at the restrictive temperature (25°C) on the first day after the dauer molt as determined by total lipid extraction followed by Thin Layer Chromatography. n = 4, * p<0.05, Student's t-test. G. L4 stage daf-7; aak-2 animals have significantly reduced BODIPY fluorescence intensity relative to daf-7 animals. Insets show the anterior portion of the animal and the bottom panel shows a zoomed-in selection from the top panel. H. Quantification of anterior hypodermal BODIPY fluorescence for daf-7 and daf-7; aak-2 animals as L4 animals. n = 10, * p<0.05, Student's t-test. Error bars represent +/-SEM.

