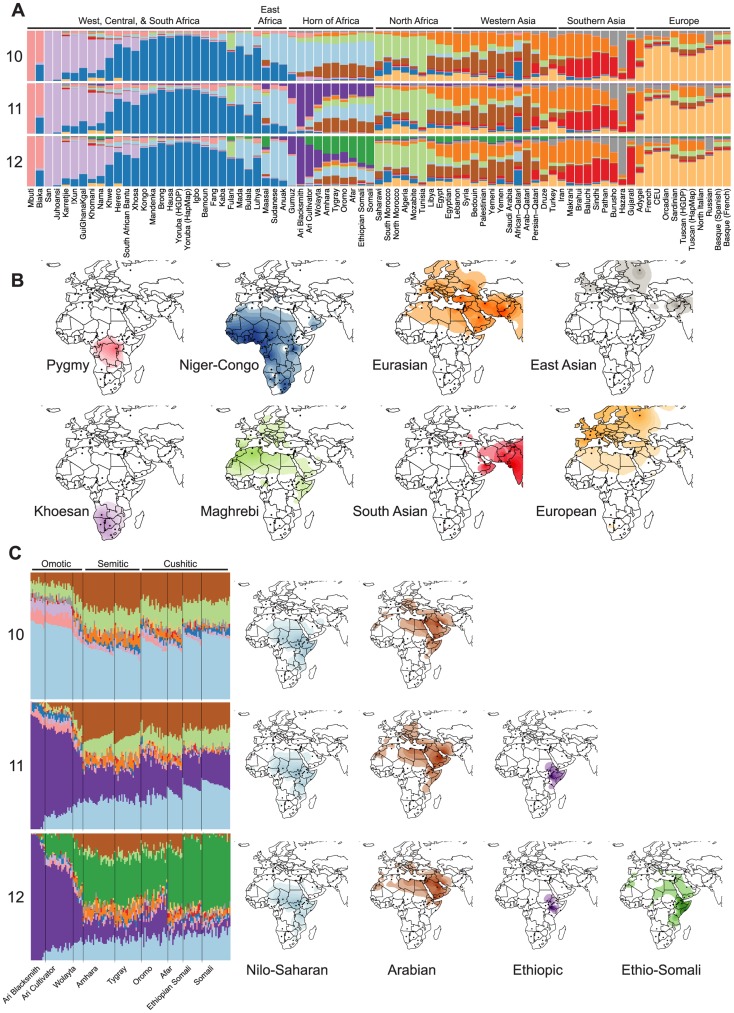
Figure 2. Population structure of Horn of Africa populations in a broad context.
ADMIXTURE analysis reveals both well-established and novel ancestry components in HOA populations. We used a cross-validation procedure to estimate the best value for the parameter for the number of assigned ancestral populations (K) and found that values from 9 to 14 had the lowest and similar cross-validation errors (Figure S2). (A) The differences in inferred ancestry from K = 9–14 are most pronounced in the HOA for K = 10–12, where two ancestry components that are largely restricted to the HOA appear (the dark purple and dark green components). (B) Surface interpolation of the geographic distribution of eight inferred ancestry components that are relatively unchanging and common to the ADMIXTURE results from K = 10–12. (C) Individual ancestry estimation for HOA populations (with language groups indicated) and surface plots of the changing distributions of the Nilo-Saharan (light blue) and Arabian (brown) ancestry components for K = 10–12. At K = 11, a new HOA-specific ancestry component that we call Ethiopic appears (dark purple) and at K = 12 a second new ancestry component that we call Ethio-Somali (dark green) appears with its highest frequencies in the HOA.

