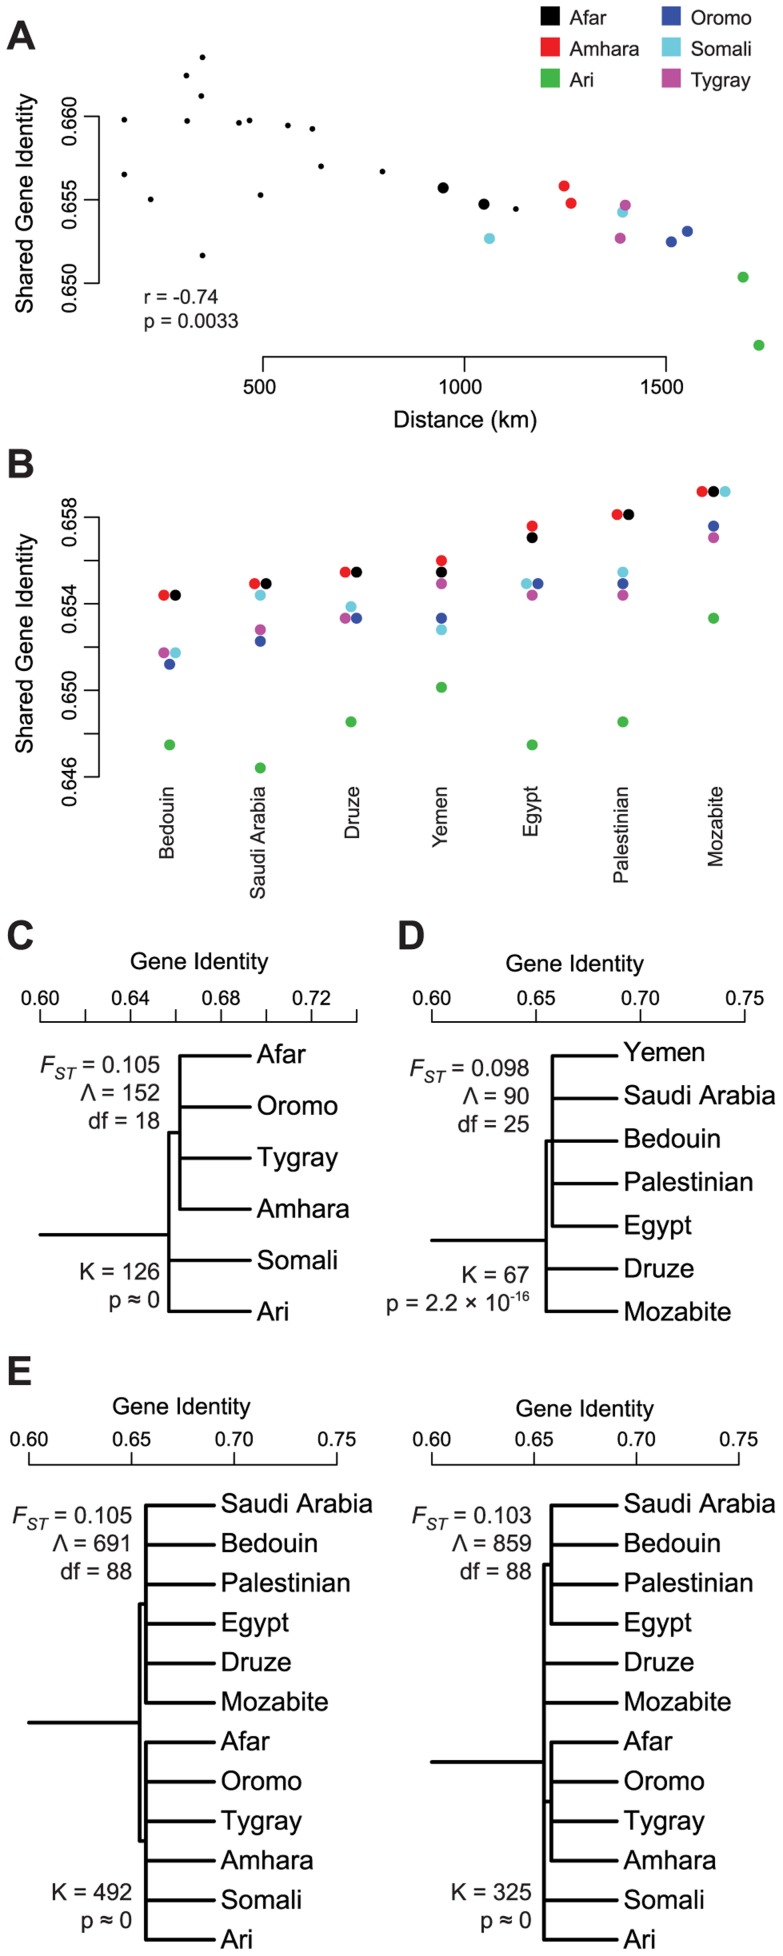
Figure 5. Tests of gene flow and population structure in the non-African ancestry of HOA populations.
Using the non-African origin partition of the HOA data identified in a chromosome painting analysis, we evaluated the evidence for gene flow with MENA populations and for population structure within and between the HOA and MENA populations. (A) The only clear and statistically significant pattern of decreasing gene identity with geographic distance was between HOA populations and the Yemen and Saudi Arabia populations on the Arabian peninsula as evaluated by a Mantel test. This relationship only held for “as the crow flies” geographic distances; the relationship disappears using a waypoint through Egypt (Figure S3). (B) Shared gene identity between the non-African ancestry partition of HOA populations and MENA populations presented in increasing order. (C) Structured population tree model within the non-African ancestry partition of HOA populations with the FST estimate from this tree model, the goodness-of-fit statistic Λ, and the likelihood ratio test statistic K for the improvement in model fit from the unstructured tree. (D) Structured population tree model within the non-African ancestry partition of MENA populations. (E) Structured population tree models for the non-African ancestry partitions of both HOA and MENA populations. Both are significantly better fits to the data than the unstructured tree and the regional structure (HOA vs MENA) is a slightly better fit to the data as measured by the goodness-of-fit Λ statistic.

