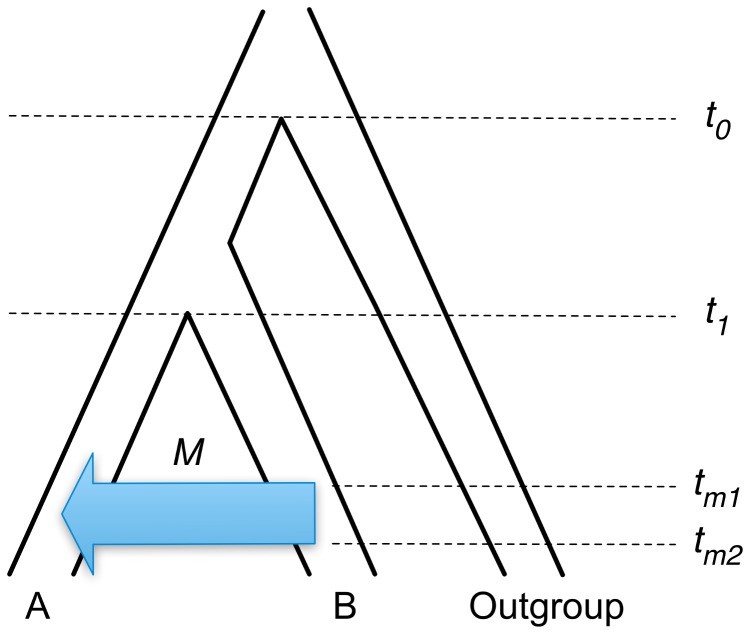
Figure 5. Model used for simulation of introgression.
Migration from population B to population A proceeds at rate  , beginning at time
  and ending at time
  . Times
  and
and  correspond to the split of populations A and B and the split of the outgroup population from the ancestral population of A and B, respectively.

