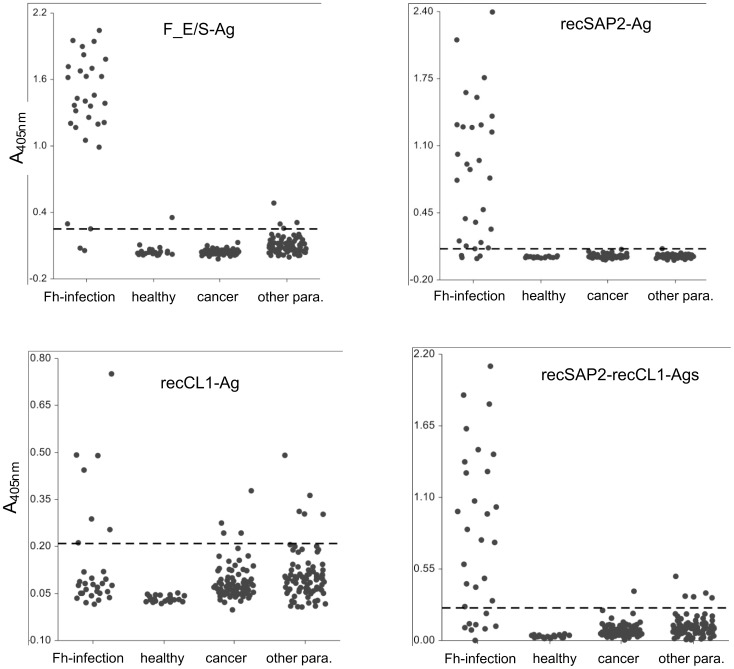
Figure 2. Dot plot showing the distribution of A405 nm values (y-axis) for the four antigens/ELISAs and for the four groups of sera tested (Fh-infection; healthy blood donors; cancer-patients, sera from patients with other parasitoses).
The dotted lines indicate the respective Youndens J max values as shown in Tab. 2 and used as threshold discriminating between positive and negative serology.

