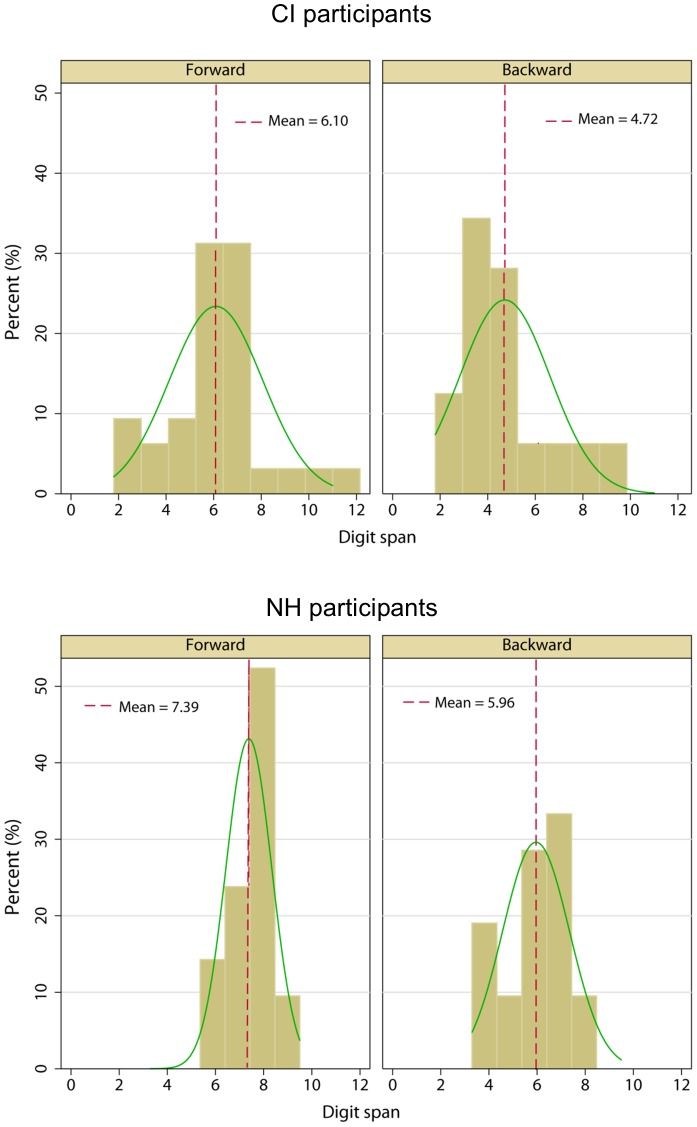
Figure 2. Distributions of forward and backward digit span scores for CI and NH participants.
The left panels show forward digit span data and the right panels show backward digit span data. The top panels show CI data and the bottom panels show NH data. The vertical dashed lines show overall mean scores. The green lines show normal-density curve lines.

