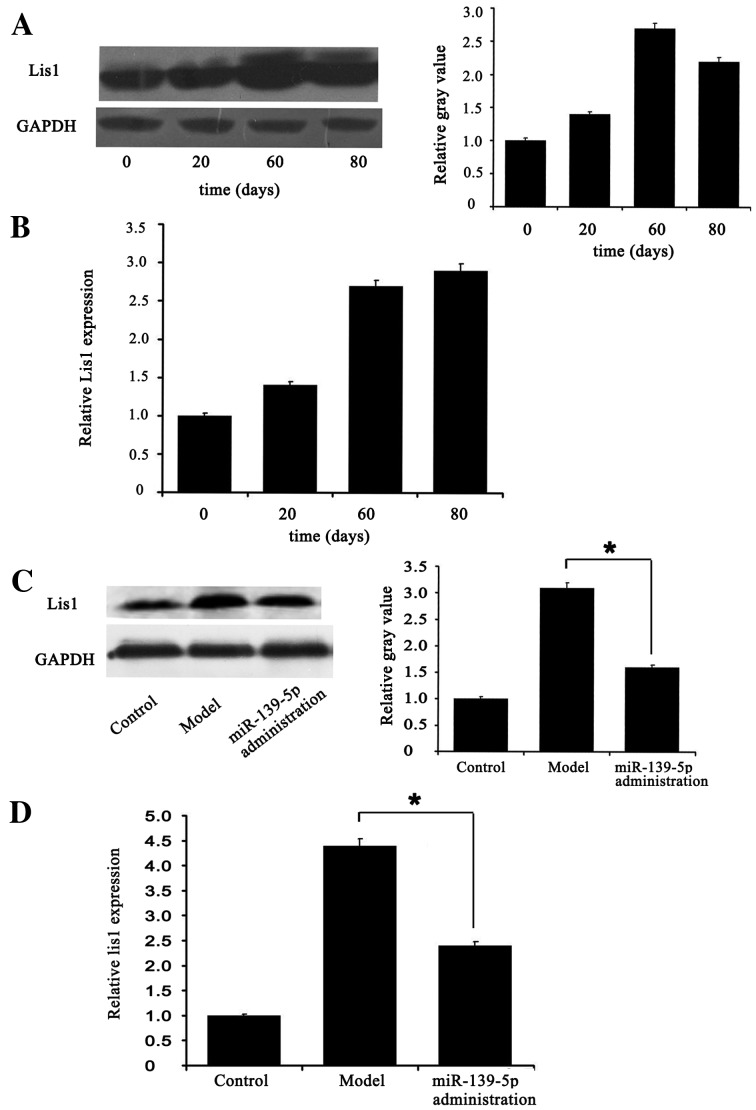
Figure 5.
Expression of Lis1 in immature rats with focal cortical dysplasia induced by liquid nitrogen lesions. (A) Western blot analysis of Lis1 protein levels shown at 0, 20, 60 and 80 days after the rat models were established. (B) qPCR of Lis1 gene expression shown at 0, 20, 60 and 80 days after the rat models were established. (C) Western blot analysis of Lis1 protein levels showing control (healthy rats), dysplasia model and miR-139-5p administration group 60 days after the rat models were established. (D) qPCR of Lis1 gene expression showing control, dysplasia model, and miR-139-5p administration group 60 days after the rat models were established. Data are presented as the means ± standard deviation (SD); *P<0.05.

