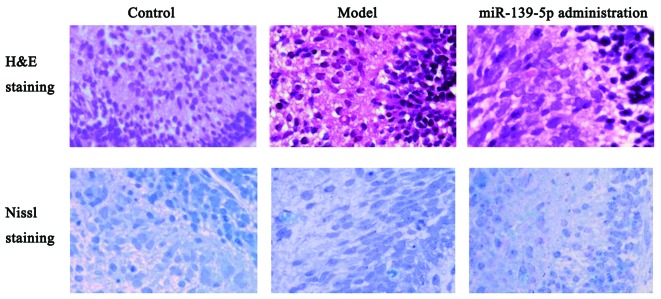
Figure 6.

(A) Cell morphology in the control (healthy group), dysplasia model and miR-139-5p administration group shown by hematoxylin and eosin (H&E) staining (magnification, ×200). (B) Cell morphology in the control, dysplasia model and miR-139-5p administration group shown by Nissl staining.
