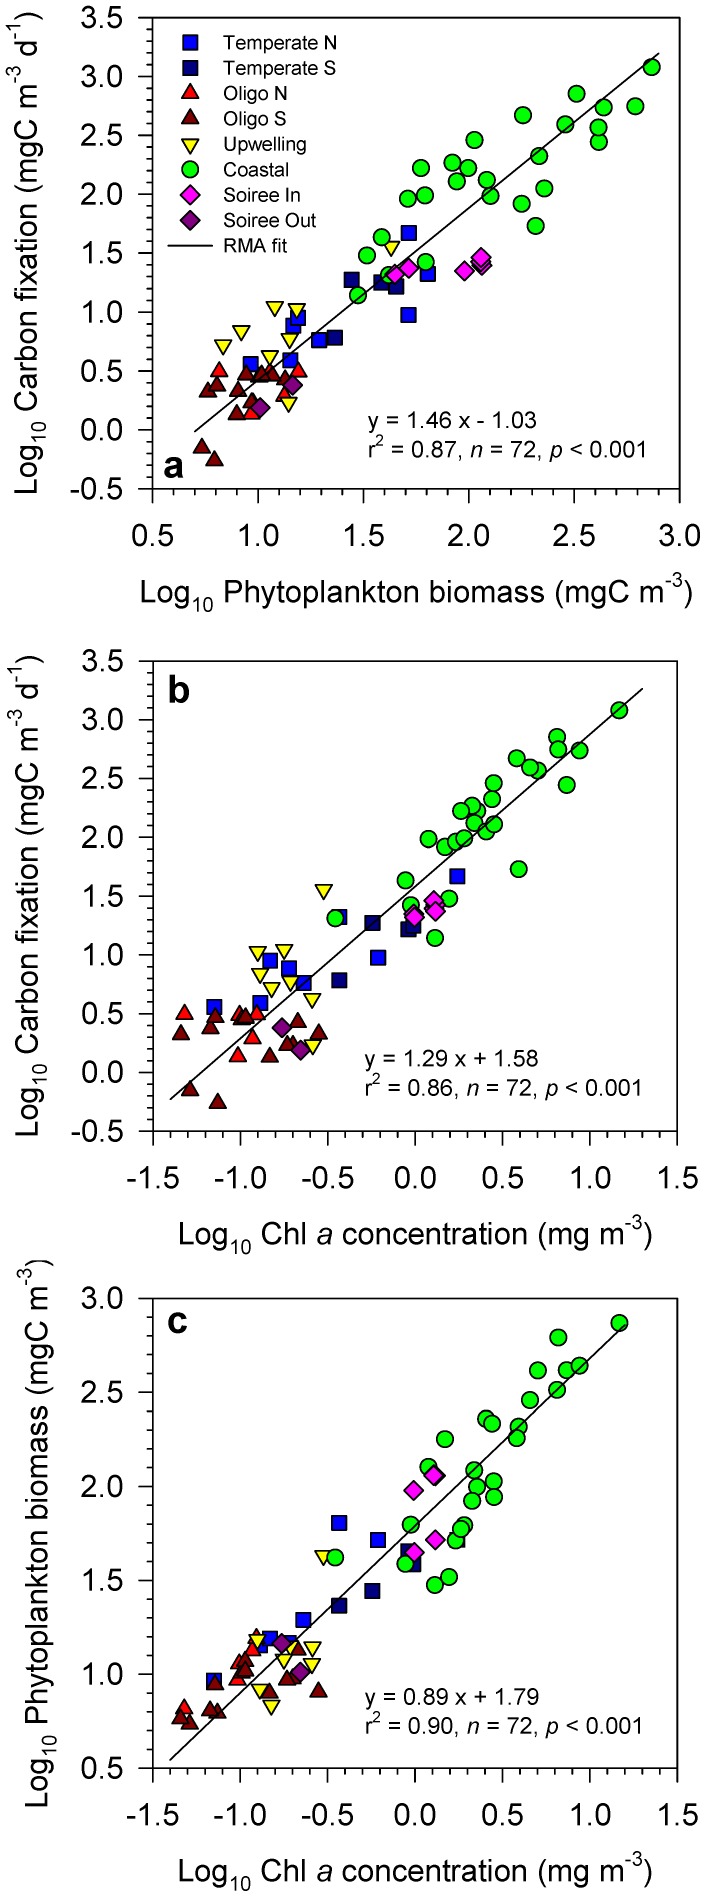
Figure 1. Phytoplankton chlorophyll a, biomass and production.
Scatterplots showing the log-log relationship between (a) primary production and phytoplankton carbon biomass, (b) primary production and chlorophyll a concentration and (c) phytoplankton carbon biomass and chlorophyll a concentration. Different symbols indicate the sampling region as defined in the Methods section. ‘Soiree In’ and ‘Soiree Out’ refer to stations located inside and outside, respectively, the iron-fertilized patch during the Soiree study. Data were fitted to a linear model using reduced major axis regression.

