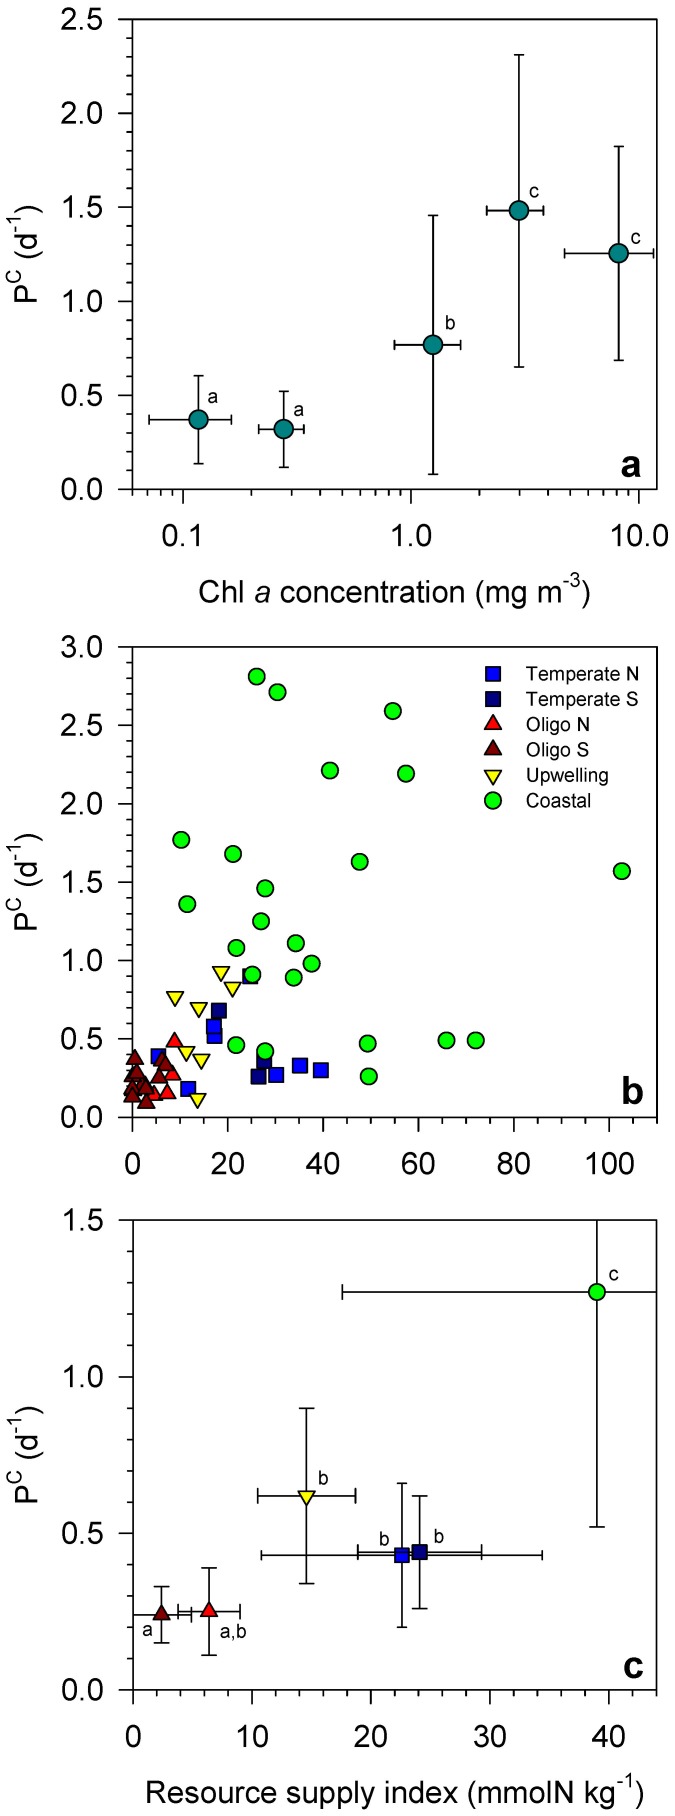
Figure 3. Resources and phytoplankton growth.
Carbon-specific production rate (PC) as a function of (a) chlorophyll a concentration (chl a) and (b, c) resource supply index (RSI). PC data in (a) were grouped into the following chl a ranges: 0–0.2, 0.2–0.5, 0.5–2, 2–5 and >5 mg m−3. Bars indicate ±1 standard deviation. Data groups labelled with different letters in (a) and (c) have significantly different PC values (Mann-Whitney U test, p<0.05). The units of RSI derive from the division of nitrate concentration by seawater density. Note that RSI is not a nutrient concentration, but reflects both nutrient and light availability (see Material and Methods for details).

