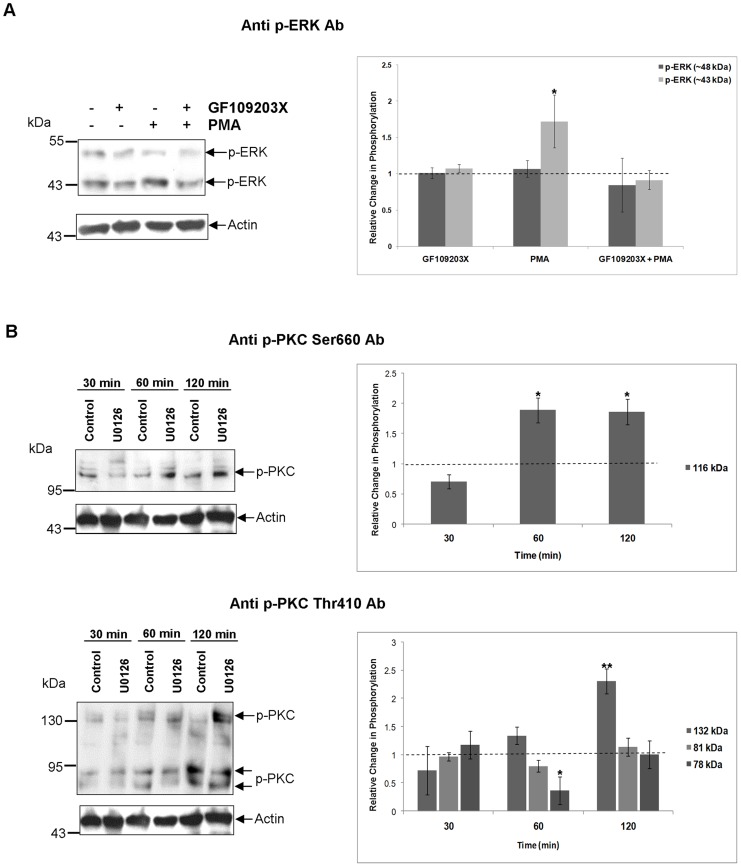
Figure 5. Connectivity between ERK and PKC signalling in S. mansoni.
Adult S. mansoni were treated with (A) GF109203X (20vM; 120 min), PMA (1 µM; 30 min), GF109203X (20 µM; 120 min) followed by PMA (1 µM; 30 min), or DMSO (vehicle control), or with (B) U0126 (1 µM; 30, 60, and 120 min) or DMSO (vehicle control). Proteins (12 µg) were then processed for Western blotting using (A) anti-phospho p44/p42 MAPK (ERK1/2) (Thr202/Tyr204), or (B) anti-phospho PKC (pan) (ζ Thr410) or anti-phospho PKC (pan) (βII Ser660) antibodies (Ab). Anti-actin antibodies were used to assess protein loading. Immunoreactive bands from three independent experiments were analysed and quantified using GeneTools and the mean relative change (± SEM; see graphs) in phosphorylation for each protein calculated relative to the phosphorylation levels of untreated (DMSO or RPMI-1640) controls that were assigned a value of 1 (shown as the dotted line). *p≤0.05, **p≤0.01 (ANOVA).

