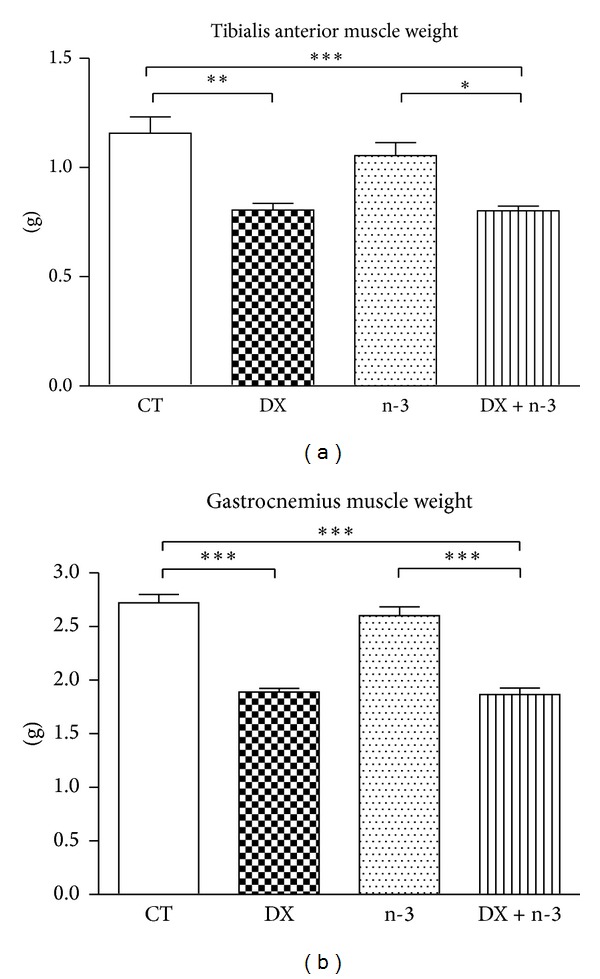
Figure 2.

Muscle weights in the DX and DX + n-3 groups were significantly decreased compared to the CT group. CT = control group (n = 6), DX = dexamethasone group (n = 5), n-3 = n-3 PUFA group (n = 6), and DX + n-3 = dexamethasone + n-3 PUFA group (n = 6). Values represent means ± S.E.M., analyzed by one-way ANOVA followed by Bonferroni post hoc test, *P < 0.05; **P < 0.01, and ***P < 0.001.
