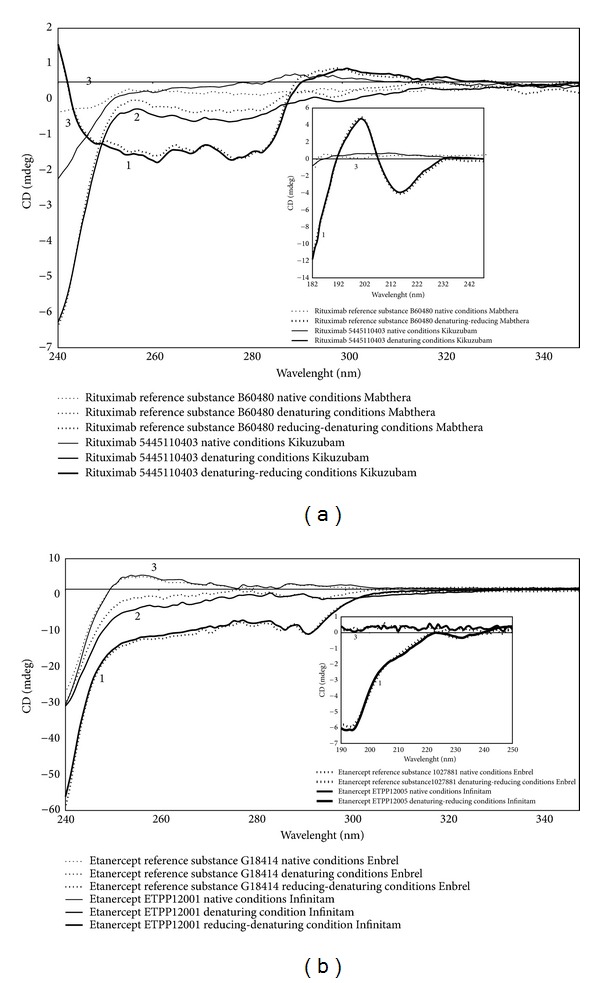
Figure 1.

Far- and near-UV CD spectra of (a) Rituximab and (b) Etanercept products under (1) native, (2) denaturing, and (3) denaturing-reducing conditions. Dotted lines represent Mabthera (Rituximab) and Enbrel (Etanercept), while continuous lines represent Kikuzubam (Rituximab) and Infinitam (Etanercept) representative batches. Main plot shows near-UV CD spectra (240–350 nm) and graphic insert shows far-UV CD spectra (190–300 nm). Near- and Far-UV characteristic spectra of Rituximab are shown in (a) and insert shows antiparallel β-sheets coming from CH1, CH2, and CH3 and VL and VH domains. Etanercept spectra (b) show an irregular structure directed probably by complex and diverse glycan substituents. Each sample was run in triplicate; average is represented as single spectrum (details are described in Section 2.3.6).
