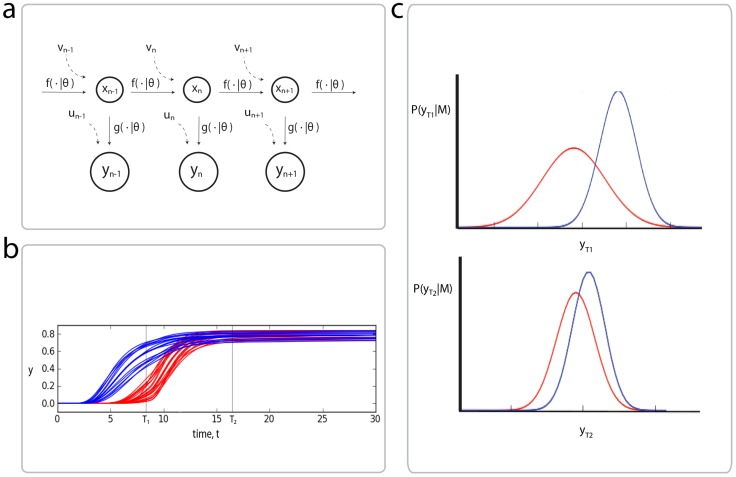
Figure 1. Outline of the proposed experimental design framework.
a) We will be concerned with state-space formulations, which model a true state,  , as it evolves under the parametric function
  subject to a process noise,
  , and observations made of this process,
  , via the 'observation' function,
  , with measurement noise
  . b) Plots of simulations from two different models (blue and red) for various parameter values, under the same experimental conditions. At time
  , the behaviour of the two models is very similar, while at time
  , the trajectories separate. c) Gaussian approximations of the model simulations at times
  and
and  (in general these will be mixtures of Gaussians) obtained via the unscented transform. Time
  is likely to be more informative than time point
  for model selection purposes. Experiments can be scored by how separated these distributions are, which we quantify using the Hellinger distance.

