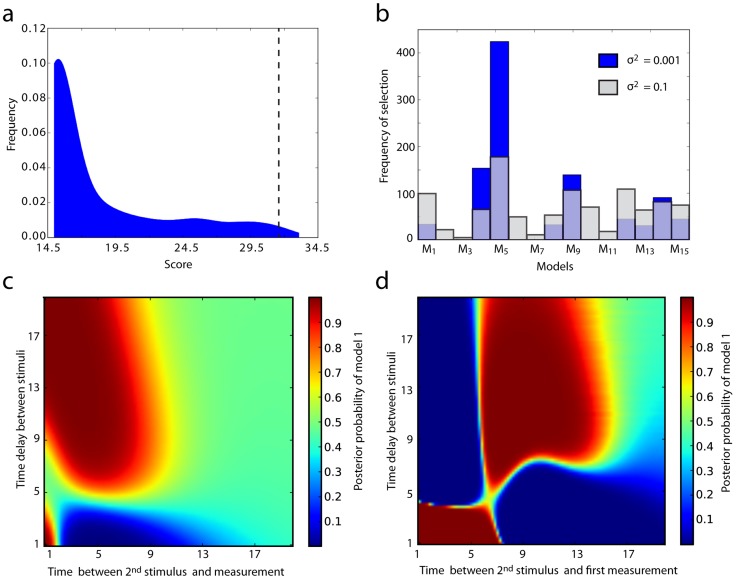
Figure 4. Robustness of model selection.
a) Frequency distribution of scores for 1000 uniformly sampled values of  . Scores concentrate around the interval
  , corresponding to very little information content. The dotted line indicates the score of
  chosen in the first round of experimental design. b) Using the 16 crosstalk models consisting of a single connection from pathway 1 to 2, a true model is fixed and 1000 uniformly sampled experiments are performed upon it. The frequencies at which the remaining 15 crosstalk models are selected, with each data set considered independently are shown. (blue) At a low level of measurement noise (with variance 0.01) model 5 is chosen most frequently, but is still outperformed for over half the experiments. (grey) When the measurement noise is increased to a variance of 0.1, the choice of model becomes even less robust. c, d) Each heatmap shows the posterior probabilities of model 1 (versus model 2), calculated independently for 9025 experiments, with data sets of different sizes (1 and 8 respectively). Each coordinate represents a different experiment, with variations to both the time delay between stimuli, and the measurement times.

