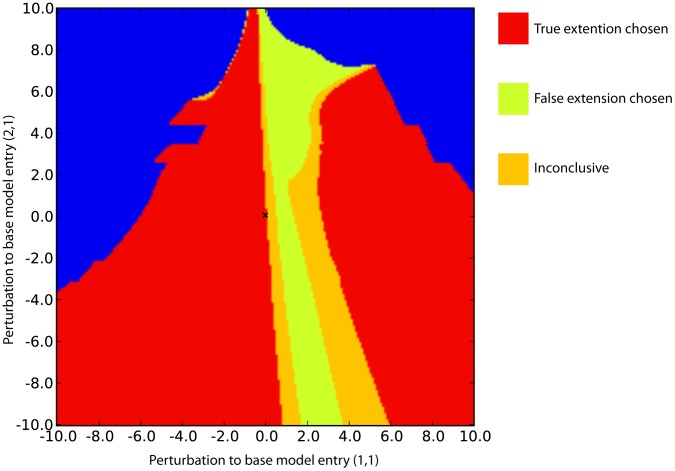
Figure 9. Model selection outcomes for  , different pairs of linear ode models.
Each model represents one of two competing hypotheses (the model extension), but with a different base model generated by perturbing Jacobian matrix entries  (x-axis) and
  (y-axis). Regions where the different hypotheses receive support are given by the red (true extension), yellow (false extension), orange (no significant support for either extension), and blue (marginal likelihood values for both models are
  ) coloured regions. Increasing the threshold for the blue region to
  results in reduction of the red region, but not of the yellow. Using the true base model (represented by the cross at
  ), the true extension is also identified.

